Optimism for 2023: The GMI Top 5 Charts That Make You Go Hmmm...
In this week’s newsletter, we’re going to again focus on several charts that are on our radar right now.
As ever, much fuller and more in-depth analysis can be found in Global Macro Investor (www.globalmacroinvestor.com) and Real Vision Pro Macro https://www.realvision.com/pricing) . Global Macro Investor is our full institutional research service and Real Vision Pro Macro is the sophisticated retail investor service, which is co-authored with leading research firm MI2 Partners.
Let’s dive right in...
GMI Chart 1 – US CPI Dashboard
First, just a quick update on Inflation.
CPI data for the month of November was released this week and came in at 7.1% YoY, below consensus expectations for 7.3% and very much in line with our thinking that the decline would start to accelerate.
Core CPI for the month of November also came in lower: 6% versus 6.1% expected and, excluding Shelter, is really starting to come down fast...
Also, Shelter is just a 15-month lagging indicator of actual house prices, so it too will soon start to come down.
As we’ve been saying for a while now, inflation cycles (due to the base effect) are almost always similar in rise and fall, especially at extremes: elevator up = elevator down!
GMI Chart 2 – S&P 500
The S&P 500 recently triggered a new daily DeMark Sequential sell Countdown 13 into trend resistance...
Short term, further downside wouldn’t surprise us as the S&P 500 is still trading at around a 5% premium to implied fair value versus domestic liquidity conditions.
And, given the ongoing communicated $95bn a month QT drain, we think that while there’s risk that equities trade lower into year-end on this basis, we’re more optimistic on 2023. More on this later...
GMI Chart 3 – Gold
Gold looks to be putting in a MASSIVE H&S bottom – a close above 1820 and it’s off to the races!
GMI Chart 4 – US Dollar Index (DXY)
DXY is approaching key support levels around 103 – something we’re keeping a close eye on...
DeMark-wise, DXY is on Sequential Countdown day 10 of 13, so there’s scope for a corrective wave higher in the short term, which would also stack up nicely with S&P trading lower and gold forming a right-hand shoulder. Let’s see...
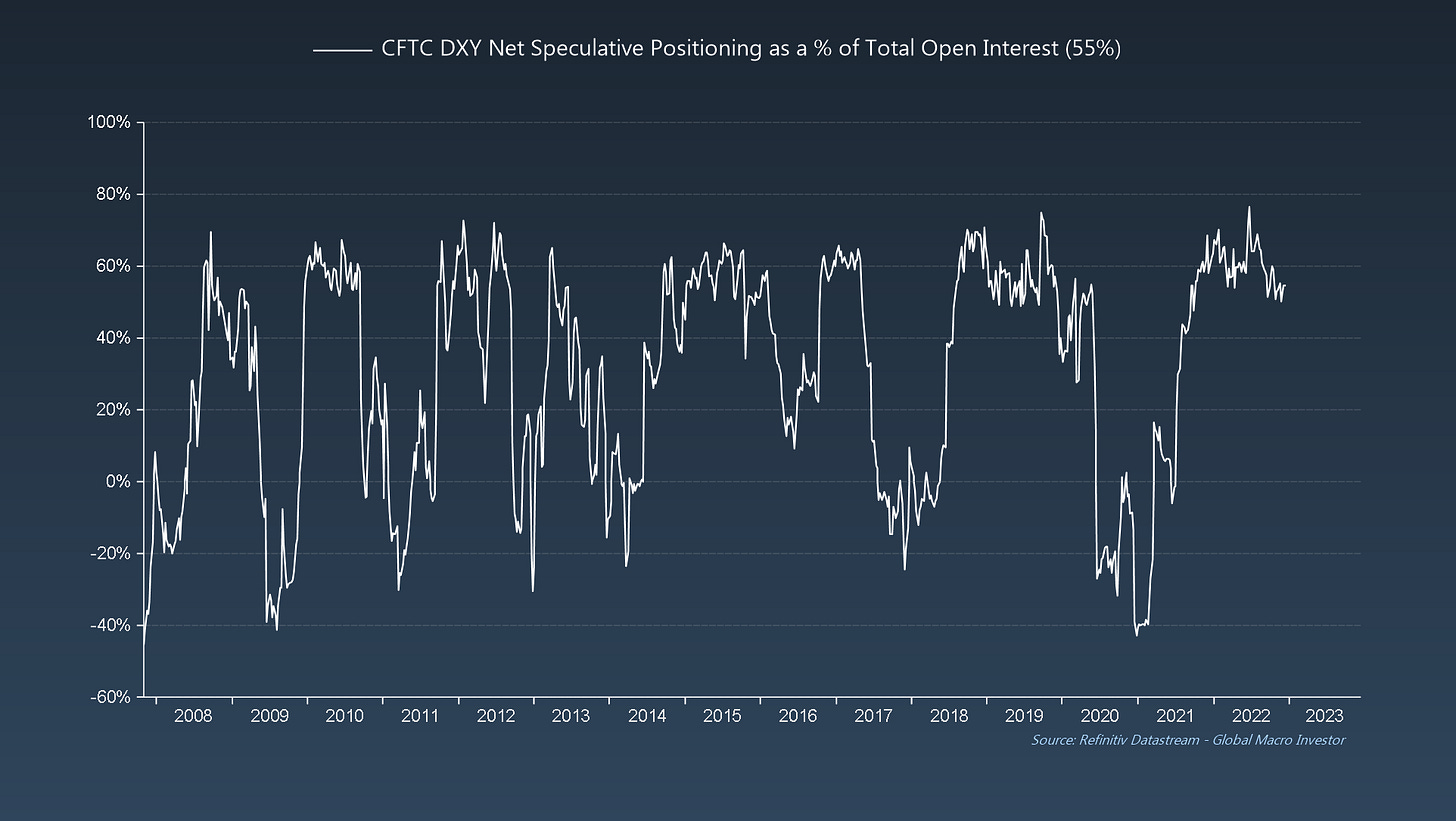
On the other hand, Speculative Positioning is still very stretched at 55% of Total Open Interest...
GMI Chart 5 – Central Bank Policy Liquidity YoY ($BN)
Finally, globally speaking, Central Bank liquidity flows are finally off the lows in year-on-year terms...
... and this is even more evident over the last six months; still a net drag but clearly heading in the right direction...
The GMI Big Picture
What’s the key take away?
The business cycle leads liquidity, and the ISM (here inverted) is forecasting significant economic weakness ahead; liquidity is thus on the cusp of turning to offset falling growth.
As recession comes into view, central banks change their policies to support the economy and, when liquidity changes, everything changes...
To conclude, whilst we acknowledge the risks that equities can trade a bit lower into year-end, we’re more optimistic on 2023 for the following five reasons:
1) Inflation has peaked and, while it’s not the only thing that matters for risk assets, it’s a big plus.
2) We expect global growth momentum to find a bottom in the first half of 2023.
3) Liquidity is king and the liquidity cycle is approaching a major inflection point.
4) Our lead indicators suggest financial conditions will soon begin to ease.
5) Literally EVERYONE is already bearish.
As we wind down this incredible year and focus all our attention on our most comprehensive monthly publication – the January GMI Think Piece – this will be the last newsletter from us for 2022.
Stay safe and good luck for the remainder of the year; wishing you, your family and friends the very best throughout the festive season and a Happy New Year.
See you all next year!
Raoul Pal – CEO, Founder - Global Macro Investor
Julien Bittel – Head of Macro Research - Global Macro Investor


