The GMI Top 5: CPI, NFIB, JOLTS Data and the Dollar
In this week’s newsletter, we are going to focus our attention on some of the month’s significant data releases, specifically the October CPI report, and the latest NFIB Small Business data...
We’ll also take a closer look at the dollar and why we think it’s the key to everything right now...
Let’s dive right in...
GMI Chart 1 – US CPI Dashboard
Headline CPI for the month of October fell to 7.7% year-on-year versus consensus estimates for 7.9%, the first negative surprise since July, and before that August 2021...
Core CPI also surprised to the downside, to which thus far, the market has been reacting very favourably.
Here’s October CPI at a glance, nearly all subcomponents came in lower this month except for housing...
GMI Chart 2 – CPI All Items Less Food, Shelter And Energy MoM%
Interestingly, if you strip housing from Core, Core CPI actually fell for the first time since May 2020...
GMI Chart 3 – Case Shiller National Home Prices vs. CPI Shelter and Supply of New Homes
... and, as we previously highlighted in this month’s GMI, the Monthly Supply of New Homes leads Home Prices by seven months and house prices lead CPI Shelter by fifteen months, so while housing is one of the stickiest subcomponents of CPI (largely because it’s so lagging), it too will soon start to come down...
GMI Chart 4 – NFIB Small Business Survey % Reporting Higher Prices YoY vs. US CPI YoY%
The October NFIB data was also released this week. The headline optimism number came in marginally below consensus expectations at 91.3 but, more importantly, small businesses continue to report a MASSIVE decrease in price pressures, which now makes for seven consecutive months of declines...
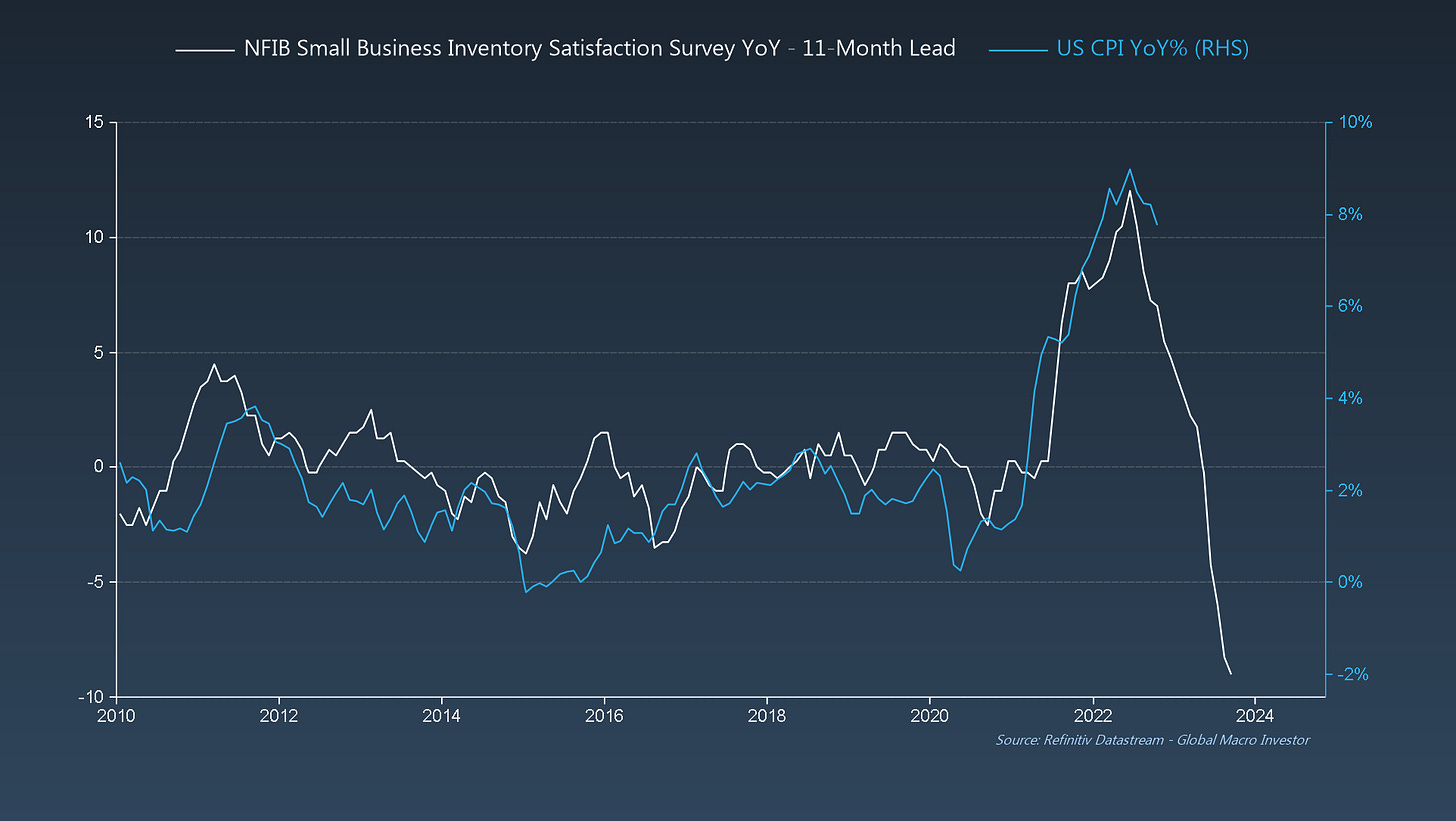
GMI Chart 5 – NFIB Small Business Inventory Satisfaction Survey vs. US CPI YoY%
Additionally, the NFIB Inventory Satisfaction Survey also fell and continues to reinforce our view that CPI will be nearer 4% by late Q1/ early Q2 of next year...
... and in year-on-year terms it makes for one hell of a shocking chart which has CPI negative by 2024...
What This All Means...
Just to repeat our thoughts from last week’s letter, inflation spikes tend to be reflexive (i.e. sharp moves higher are almost always followed by sharp moves lower) ...
... and, based on both the mean trajectory of prior inflation outbursts plus what lead indicators are currently suggesting, the decline in CPI should really start to accelerate from here...
Switching gears now to the labour market for an update, the Great Resignation also continues to lose steam – something we’ve been talking about for quite some time now.
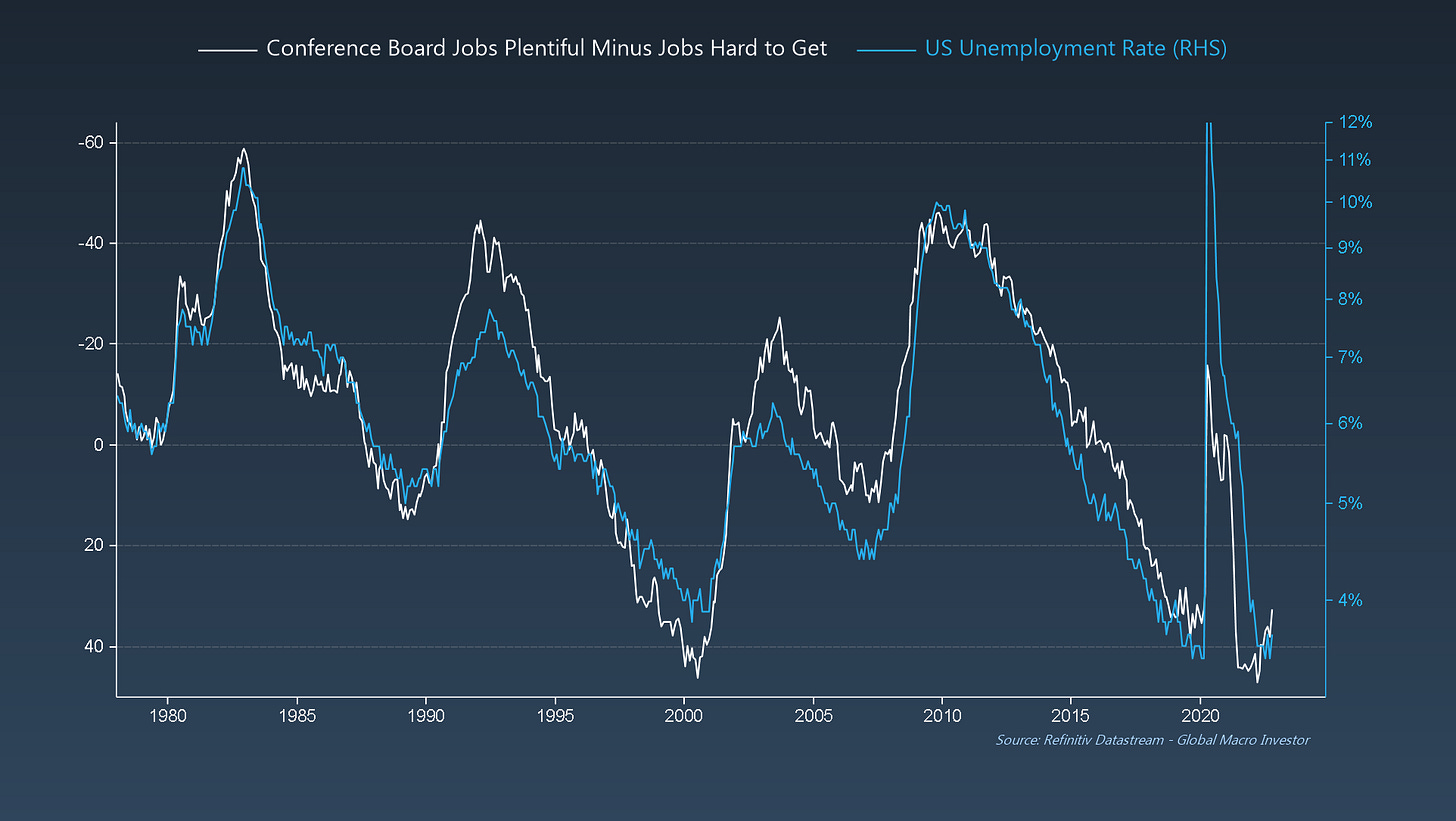
According to the latest JOLTS report, voluntary job separations fell again, making for the fifth decline in six months. Additionally, the latest data from the Conference Board suggests this trend should continue...
If you then invert the Conference Board Index, you should understand why we continue to believe a change in current labour market dynamics is upon us, and that unemployment will soon start to rise...
The GMI Big Picture
The bottom line is that as inflationary pressures continue to ease and labour market weakness starts to become more evident in coincident and lagging data such as unemployment, the Fed should begin to change their tune. The first place to look for signs that something has changed is the dollar... the key to everything right now.
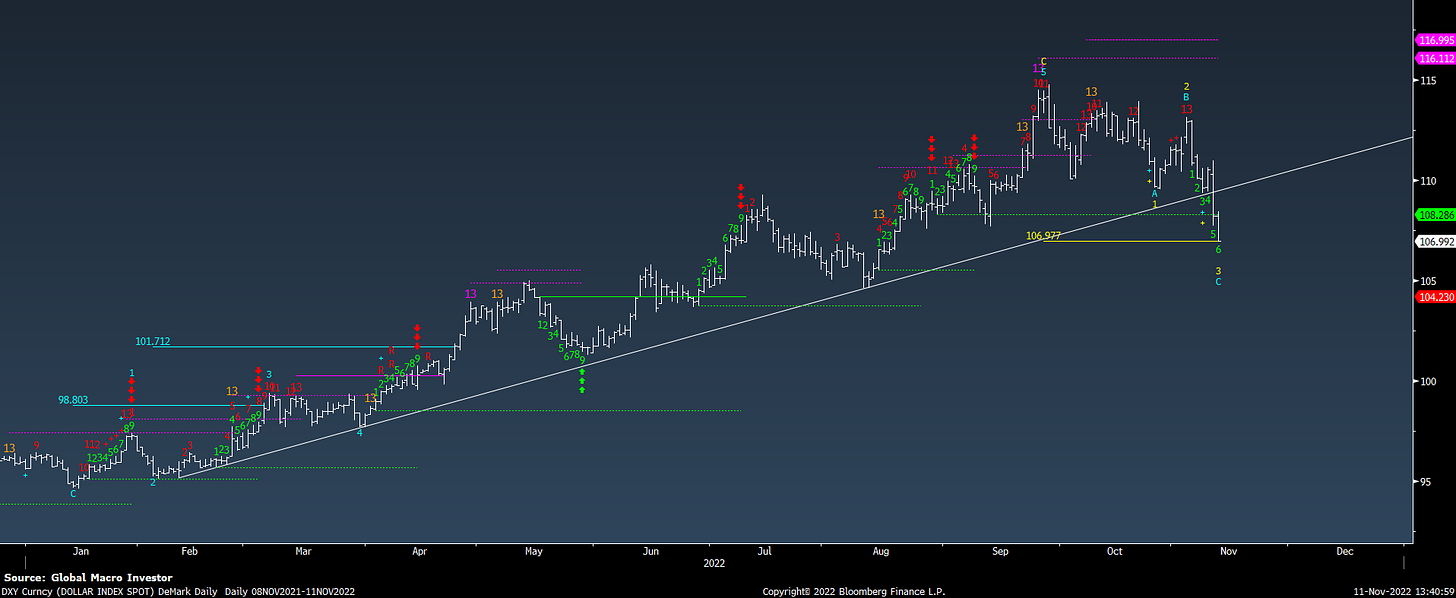
DeMark-wise, last week DXY triggered a new daily Sequential sell Countdown 13, which resulted in a big drop on Friday, with prices continuing to work lower throughout the week and breaking key support...
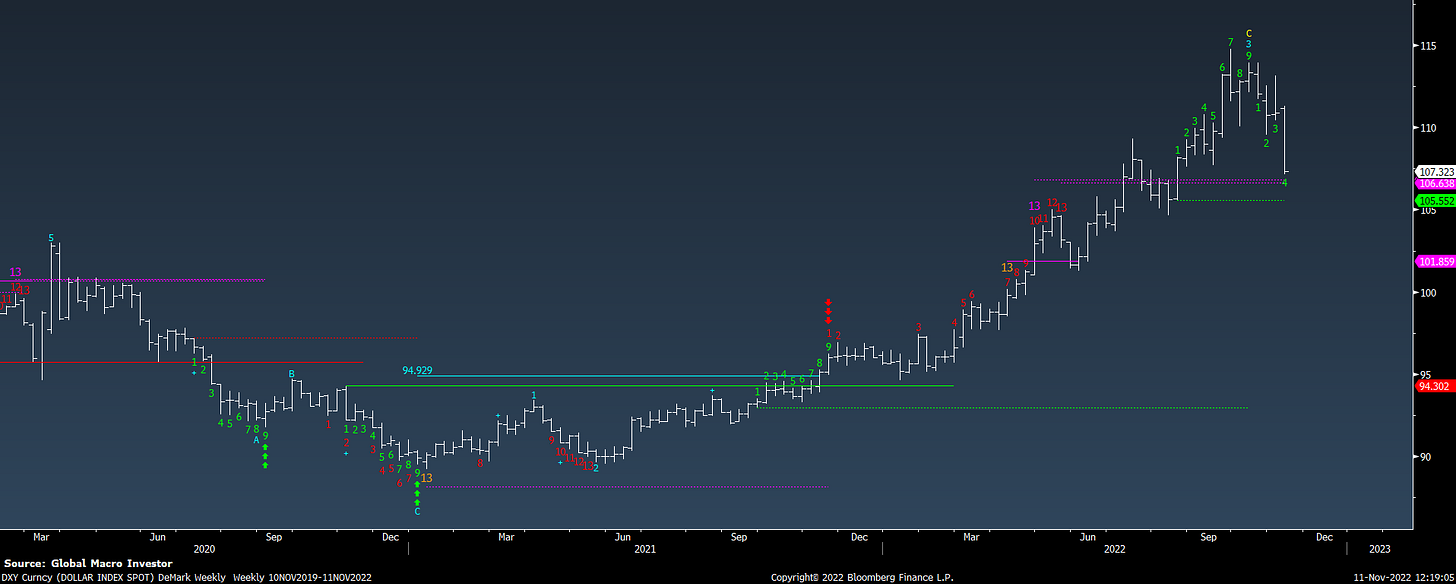
The weekly chart also shows a 9/13/9, something we’ve previously highlighted, which again increases the odds of further downside as peak hawkishness begins to get priced in; we don’t think this is the end of the long-term dollar uptrend but a potentially significant correction...
... and, as the dollar starts to work lower, this will start to ease up bond market liquidity...
... which would then mean that bond yields should FINALLY start to come down...
Peak dollar + peak rates = a HUGE easing of financial conditions...
This would be broadly positive for risk assets – especially Emerging Markets – where everyone is bearish.
I’m not totally sure we hold the breakout on this attempt with a new daily 9 sell Setup in place, but should we get additional confirmation that the dollar has peaked (for now), the first place to look for validation would be EM.
It is still early days but so far so good... something to have on your radar...
That’s all from us this week.
See you all next week with another update; enjoy the remainder of your weekend!
Raoul Pal – CEO, Founder - Global Macro Investor
Julien Bittel – Head of Macro Research - Global Macro Investor


