


The GMI Top 5 - Inflation

In this week’s newsletter, we are going to home in on the Top 5 Global Macro Investor charts that matter for CPI...
As ever, much fuller and more in-depth analysis can be found in Global Macro Investor (www.globalmacroinvestor.com) and Real Vision Pro Macro (https://rvtv.io/ProMacro). Global Macro Investor is our full flagship research service and Real Vision Pro Macro is our retail investor service, which is co-authored with leading research firm MI2 Partners.
Let’s get started...
September’s highly anticipated US CPI data was released this week. Headline CPI came in a bit hotter than expected at 8.2%, consensus was looking for 8.1%...
It's understandable why people are so worked up about this; Headline CPI remains near a 40-year high and Core CPI recently increased to 6.6% year-on-year, the highest annual rate since August 1982!
It’s really scary stuff, but...
... the key issue here is that CPI data is extremely lagging and therefore gives us a false sense of what conditions actually look like today when, in fact, current CPI data is really a reflection of how the economy looked some 6-12 months ago, and so we are really looking in the rearview mirror.
GMI Chart 1 – Monetary Policy
The collapse in G4 Central Bank Balance Sheet growth has CPI below 0% by 2024. They have overtightened.

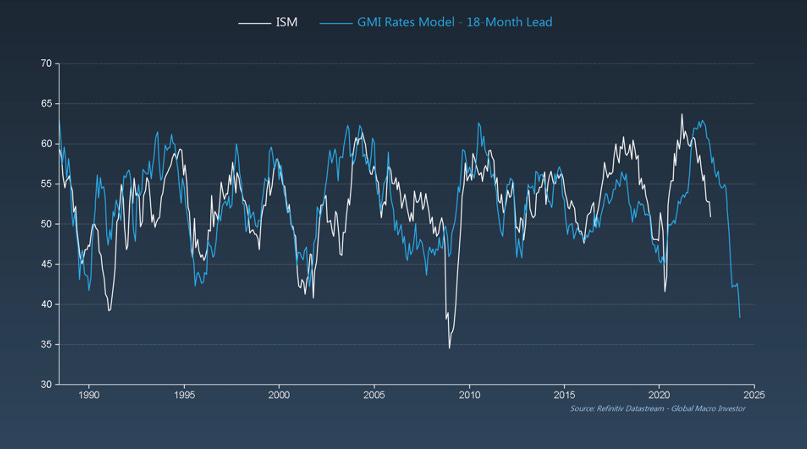
GMI Chart 2 – The Business Cycle
Rate hikes have killed demand. Inventories are at record highs and New Orders are falling. That always leads to price cuts to clear out inventories.

GMI Chart 3- Commodity Prices
Falling demand and the rising dollar have dramatically lowered commodity price pressures too...

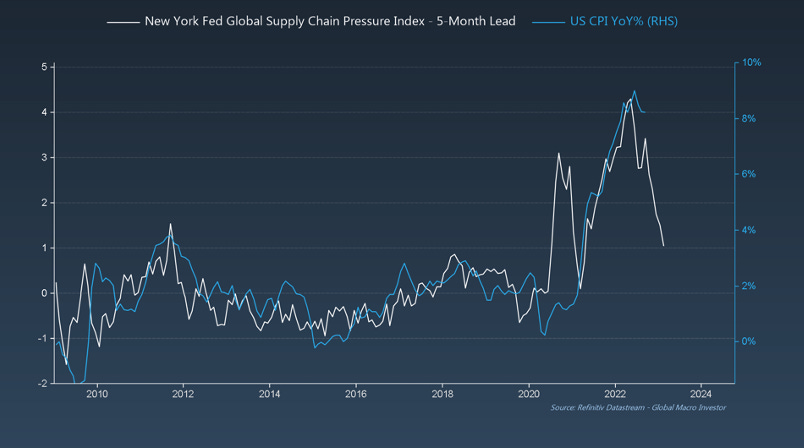
GMI Chart 4 – Supply Chains
The Global Supply Chain Pressure Index continues to ease and suggest CPI is headed much lower...
GMI Chart 5 - Wages
Compensation Plans have already peaked, and wages will follow. Wages lag the rest of the cycle.

What this all means
The risk is that the Fed are overtightening due to their focus on current CPI data. The Fed is still very much chasing The Ghost of the Past, waging war on Volcker’s inflation of the late ‘70s, thinking they too can be crowned as the heroes that took down the beast that is inflation. But post-pandemic inflation is not the 1970s. It was more likely to mean revert over time, so the Volcker rule book is going to lead to a big collapse in economic growth into an already slowing inflation cycle...
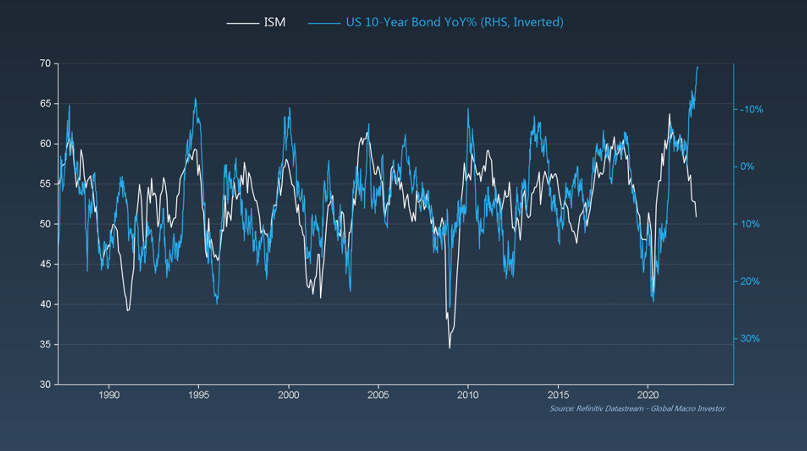
And yet, bonds are still diverging from the business cycle by a record amount. We saw similar in 1994, 2000 and 2014. Each episode saw a very dramatic fall in yields. If the ISM drops below 40 as projected, 10-Year Yields could even fall to 1%.
The GMI Big Picture
Our view at GMI is that inflation will fall dramatically in the coming 18 to 24 months and may even turn negative. Our base case is a similar replay to the 1940s – the double CPI whipsaw.

The next cycle will bring renewed inflation pressures (they always do) but it will be less severe than this unique “Pandemic Cycle” inflation.
Overall, inflation will continue to remain relatively subdued over a more extended period of time as the full impact of the deflationary effects of technology, debt and demographics will weigh on prices. Who knows if deflation will remain the trend or we see a slightly higher inflation range (but not very high). It is too early to tell.
The remarkable parallel with the post-war years remains our best guide.
But remember, the only game in town is financial repression, with negative real yields the only way to reduce the debt burden over time unless The Exponential Age in technology can increase productivity and thus GDP growth. Time will tell although that will play out over a decade or two.
Raoul Pal – CEO, Founder - Global Macro Investor
Julien Bittel – Head of Macro Research - Global Macro Investor