In this week’s newsletter, we’re going to run through several interesting charts on our radar...
As ever, much fuller and more in-depth analysis can be found in Global Macro Investor and Real Vision Pro Macro. Global Macro Investor is our full institutional research service and Real Vision Pro Macro is the sophisticated retail investor service, which is co-authored with leading research firm MI2 Partners.
It was a big data week this week, so we have a lot to get through. Let’s dive right in...
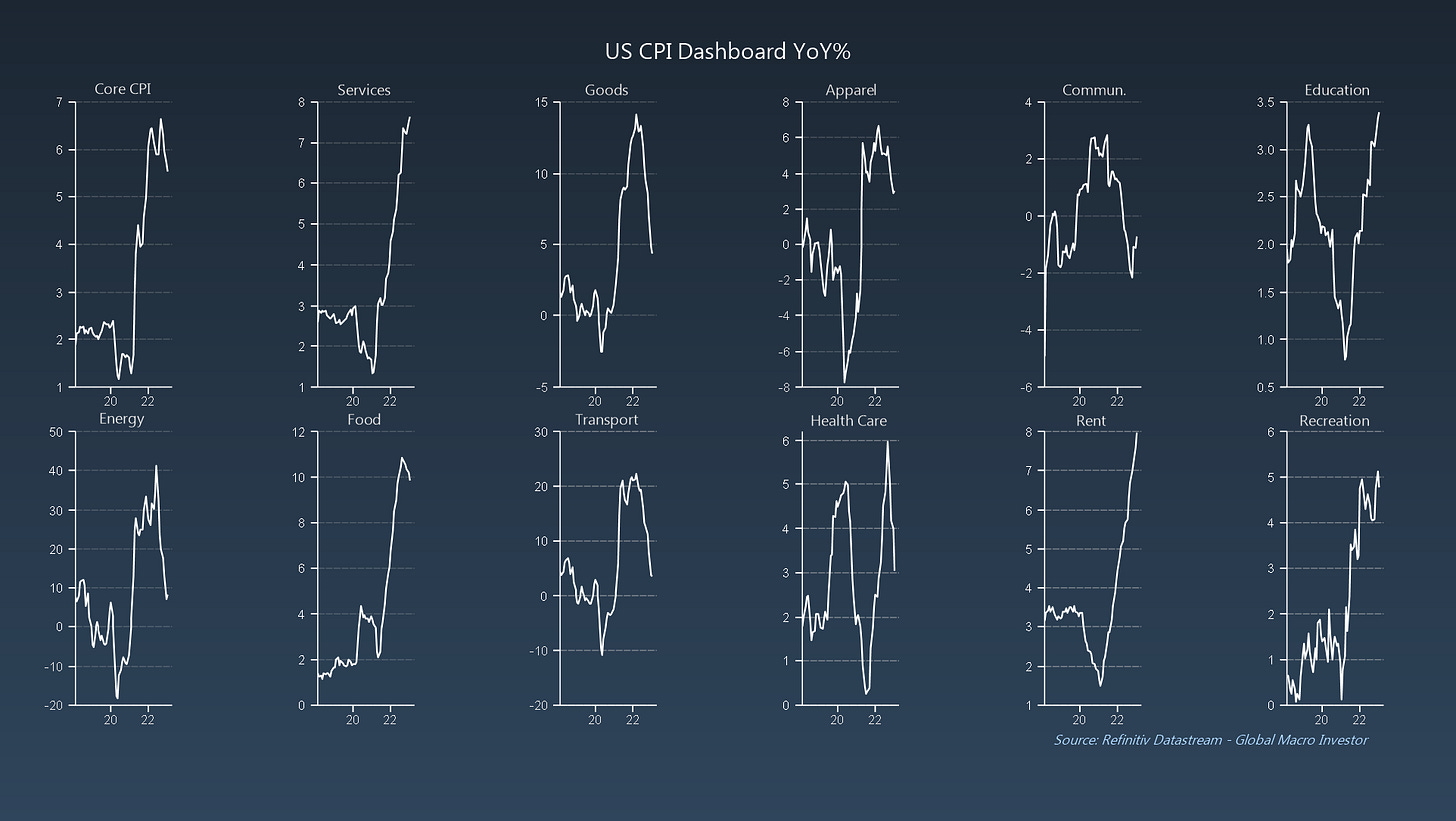
GMI Chart 1 – US CPI Dashboard
First, a quick update on inflation.
CPI data for the month of January was released this week and came in at 6.4% YoY, with all major subcomponents of CPI having peaked, Services being the only exception...
We know that Services accounts for nearly 60% of CPI and, as Shelter makes up the bulk of that figure at 59% and accounts for 34% of total CPI, Shelter is the main reason CPI remains elevated...
GMI Chart 2 – Case Shiller National Home Price Index YoY% vs. CPI: Shelter YoY%
Shelter is an incredibly lagging component of CPI and just lags home prices by fifteen months, so it too will soon start to come down. In fact, the term “sticky” is just a fancy Econ. term for lagging...
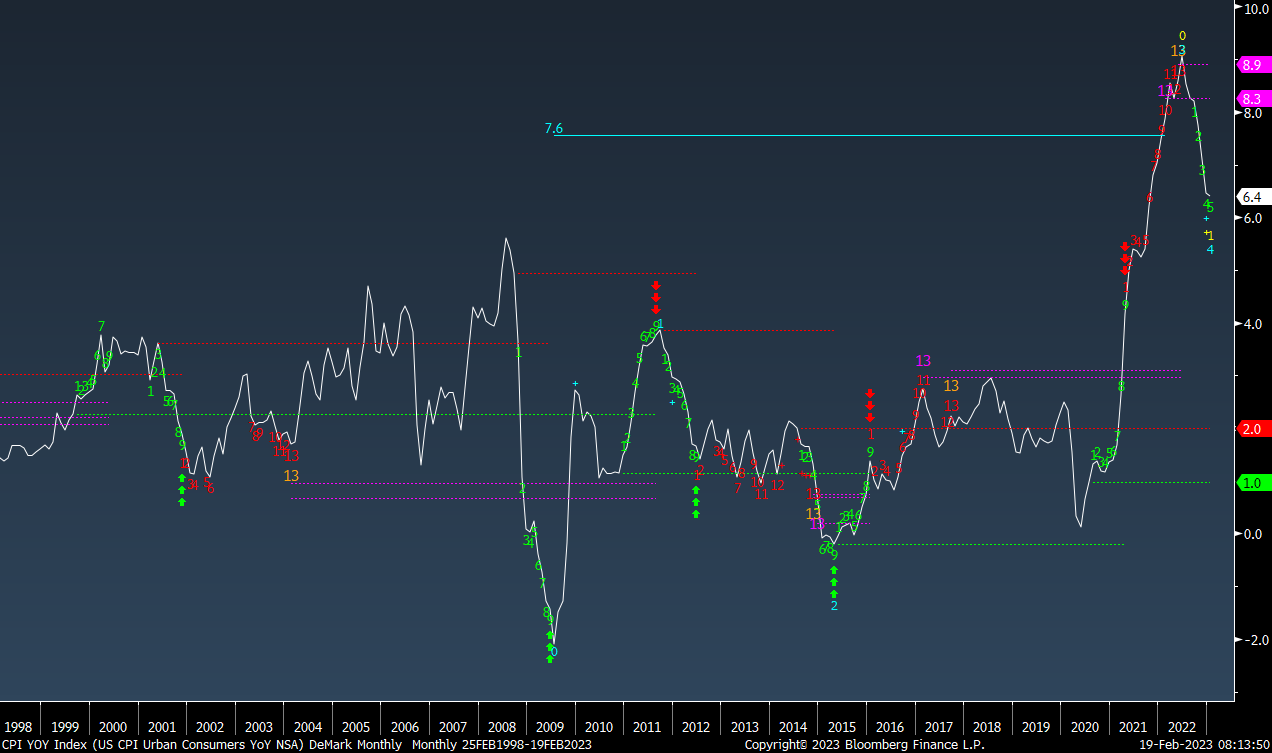
GMI Chart 3 – CPI Services Less Energy Services with Monthly DeMark Indicators
This month CPI Services also triggered a new monthly DeMark Sequential Sell Countdown 13...
... which worked well in flagging the top in Headline CPI back in June of last year...
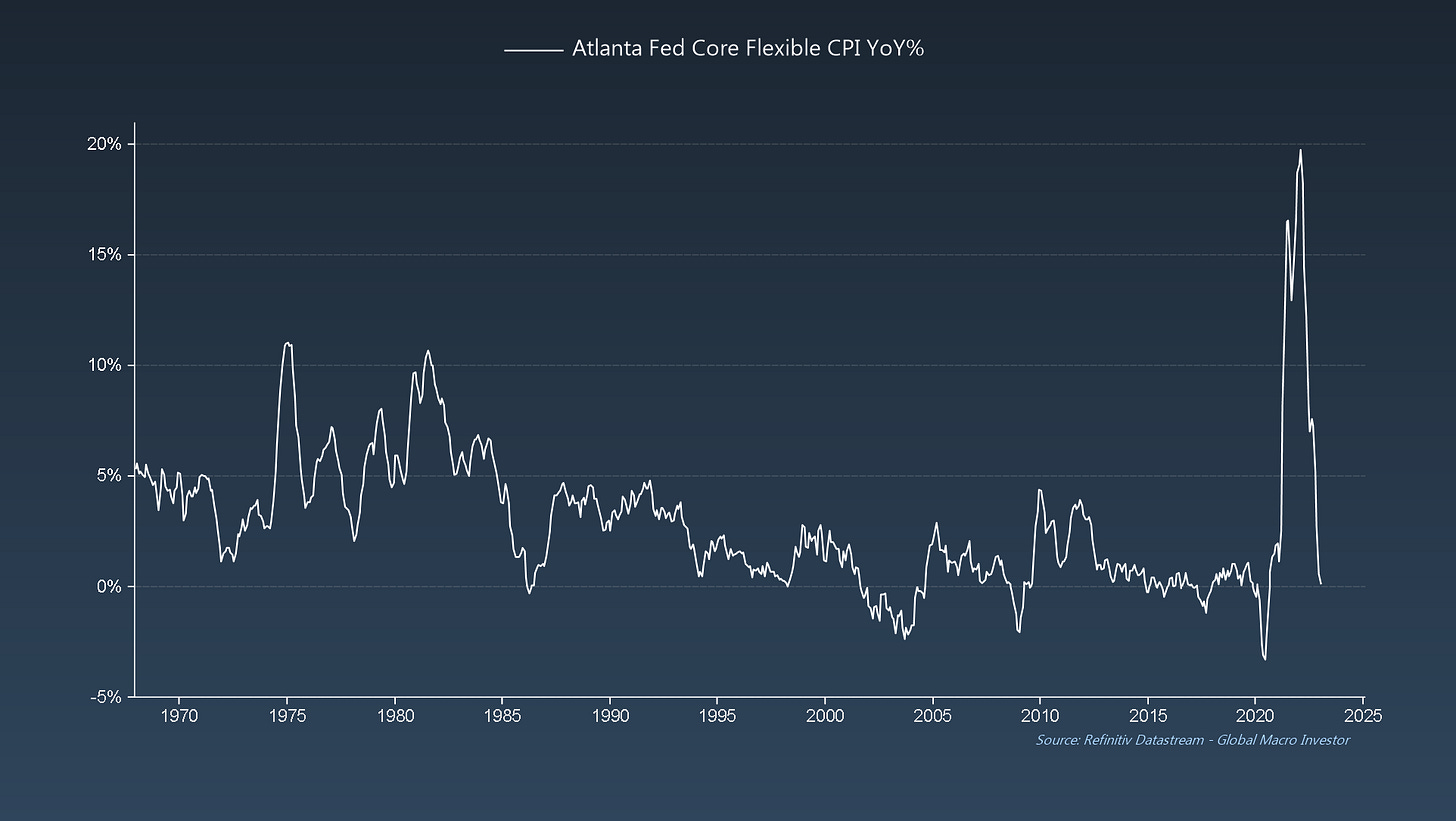
GMI Chart 4 – Atlanta Fed Core Flexible CPI YoY%
Additionally, if we look at the Atlanta Fed's measure for "Flexible" CPI – basically commodities ex. food and energy (i.e., household supplies, appliances & clothing) – the measure has done a full round trip: 19.7% in February 2022 to just 0.1% in January. Think of this as goods inflation...
As we’ve been saying for a while now, inflation cycles (due to the base effect) are almost always similar in the rise and fall, especially with extreme moves: elevator up = elevator down...
GMI Chart 5 – NFIB Small Business Inventory Satisfaction Survey vs. US CPI YOY%
Finally, this week we also got the January NFIB Small Business Optimism data, where US small businesses continue to communicate poor satisfaction levels around persistent high levels of inventories, leads CPI by seven months, and currently has CPI nearer 2%...
... and indeed, inventories are still way too high; price cuts are coming...
The GMI Big Picture
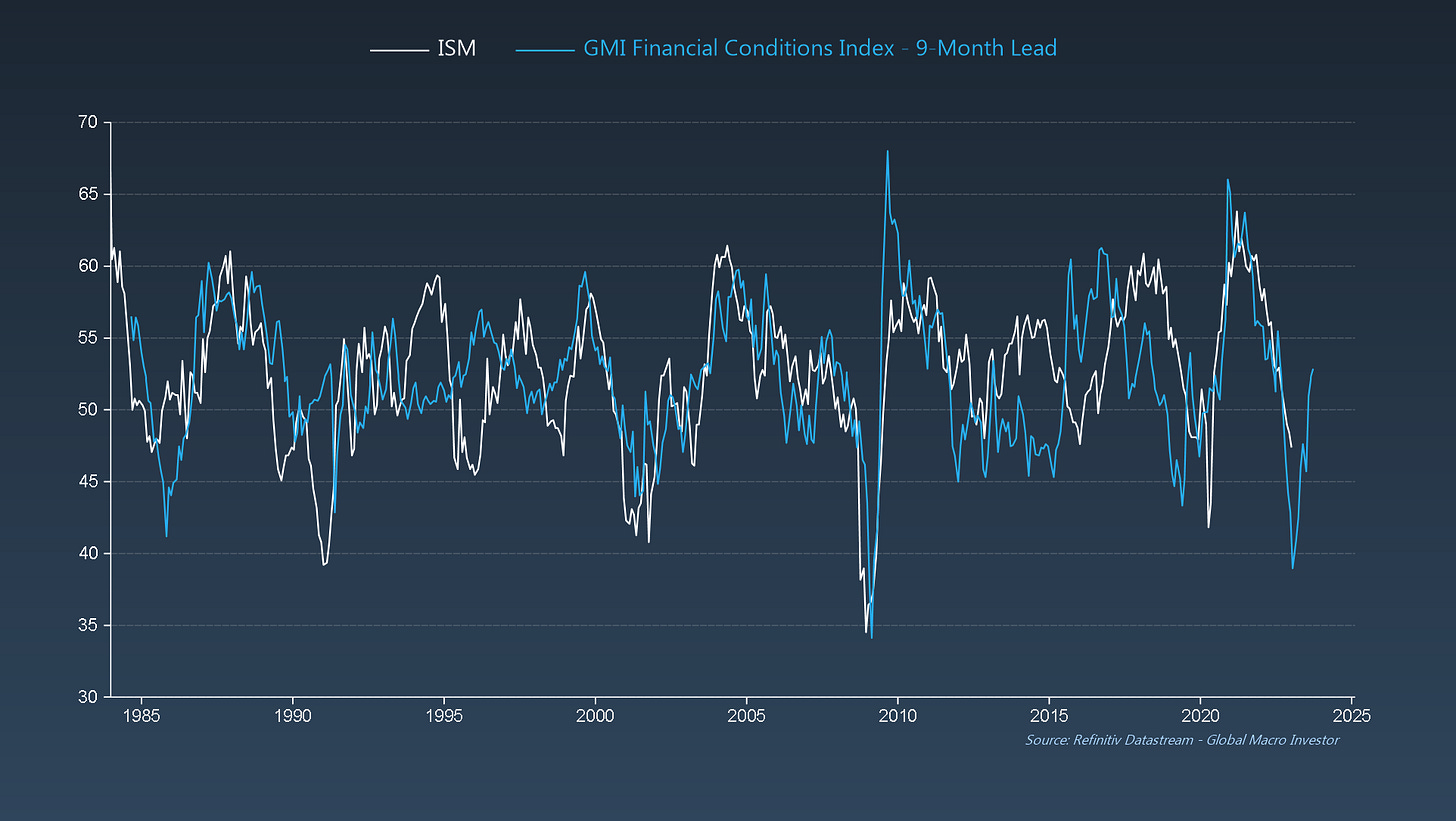
Another bit of data that came out this week was the Q1 data for US CEO Confidence, and no one is talking about it...
As we have been expecting, confidence actually improved on the back of weaker inflation data and a general easing of financial conditions after reaching the lowest levels since the GFC, and currently targets the ISM to fall briefly below 40 before improving...
... which is exactly what our GMI Financial Conditions Index was forecasting back in May of last year...
Also, versus the Goldman Sachs Financial Conditions Index you can see why we’ve been talking about financial conditions easing for months now, despite consensus looking the other way up until October when the Goldman measure finally peaked (here inverted)...
To conclude, the below Tweet from Raoul on Friday sums up our current views well...
See you all next week. Enjoy!
Raoul Pal – CEO, Founder - Global Macro Investor
Julien Bittel – Head of Macro Research - Global Macro Investor


Love these Raoul ... don't you dare stop! ever!
I enjoyed reading it, thank you very much.