In this week’s newsletter, we’re going to run through the top five charts that are on our mind...
As ever, much fuller and more in-depth analysis can be found in Global Macro Investor and Real Vision Pro Macro. Global Macro Investor is our full institutional research service and Real Vision Pro Macro is the sophisticated retail investor service, which is co-authored with leading research firm MI2 Partners.
Let’s dive right in...
GMI Chart 1 – G5 Liquidity Cycle YoY
This year we’ve written extensively about the importance of monitoring the liquidity cycle when it comes major inflection points for risk assets; based on our work you can see that the liquidity cycle bottomed in October of last year and our lead indicators suggest that liquidity will continue to trend higher in 2024...
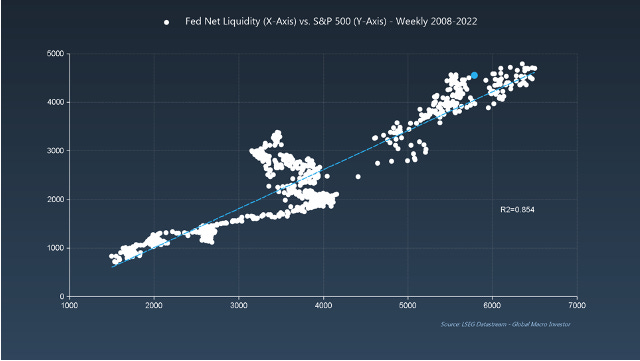
GMI Chart 2 – Fed Net Liquidity vs. S&P 500
If we focus on the US and look at Fed Net Liquidity, you can see that liquidity is one of the most important drivers of equity performance over the long term...
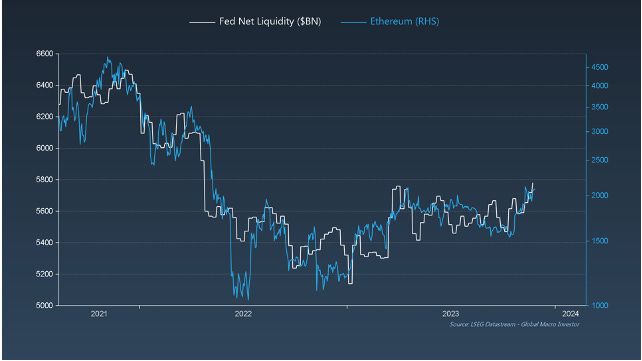
GMI Chart 3 – Fed Net Liquidity vs. Ethereum
... and this relationship is even stronger for the crypto markets where Ethereum, for example, is basically a pure play on liquidity...
GMI Chart 4 – Ethereum (short term)
Speaking of Ethereum, we’re currently in the process of testing very important levels. We have been highlighting the bull flag chart pattern in Ethereum – which we recently cleared – for several weeks now and it looks like we could be forming a larger cup-and-handle pattern. A close above 2,150 would be very positive. Something to keep an eye on...
GMI Chart 5 – Ethereum (long term)
... and if we zoom out using weekly data, Ethereum has already broken out from its near-perfect wedge pattern; it’s a very bullish chart...
The GMI Big Picture
Underneath the surface, things in Crypto Land have been changing very quickly. Nearly 40% of the 300 Altcoins that we track at GMI have been outperforming Bitcoin over a rolling 90-day period.
Think of the following chart like a traditional credit spread but inverted. During periods of slower growth, credit spreads tend to widen, signalling investor demand for higher yields to compensate for the increase in the perceived risk of default. Crypto Land is no different. When the macro is negative, investors tend to retreat from further out the crypto risk curve and hug the benchmark (i.e., Bitcoin) and Bitcoin outperforms. On the other hand, when liquidity turns positive and lead indicators start to turn higher, investors start to reach further out the crypto risk curve looking for even larger gains in smaller, earlier-stage projects. It’s classic risk-seeking behaviour and the rotation over the summer has been fully consistent with our work at GMI.
The signal to have looked out for was the cross below the 10% threshold back in June of this year; this was telling you that something was about to change...
Remember, crypto is macro and macro is crypto. Get the macro right, you get the crypto right.
That’s it from us this week. There will be no weekly update from us next week as we are writing the December GMI Monthly.
Remember, this is just a very small fraction of the work we do at GMI.
We cover the biggest secular themes in macro, crypto and technology within a full business cycle framework and also include our comprehensive GMI asset allocation model as well as our GMI model portfolio with an unrivalled, fully-recorded performance going back nineteen years.
You can find the story of GMI here: The Story of Global Macro Investor
If you would like to receive full, ongoing, detailed access to our work at Global Macro Investor (GMI) then you can apply here Global Macro Investor (GMI) or, if that is out of your price range, then a membership to the Real Vision Pro Macro Research Service may be a perfect fit.
Enjoy.
Raoul Pal – CEO, Founder - Global Macro Investor
Julien Bittel – Head of Macro Research - Global Macro Investor


The last chart is gold - pure alpha if used correctly as a leading indicator. Thank you for sharing it freely.
As always, great charts and very useful analysis!