The GMI Top 5 Weekly Charts That Make You Go Hmmm...
In this week’s newsletter, we’re going to run through the top five market charts on our radar right now.
As ever, much fuller and more in-depth analysis can be found in Global Macro Investor and Real Vision Pro Macro. Global Macro Investor is our full institutional research service and Real Vision Pro Macro is the sophisticated retail investor service, which is co-authored with leading research firm MI2 Partners.
Let’s dive right in...
GMI Chart 1 – US Regional Banks (KRE)
US Regional Banks (KRE) recently triggered a daily DeMark Sequential Countdown 13 buy signal, bang on the $35 price target that we set back in early March, having been alerted to what was going on with SVB and having also identified the large head-and-shoulders top pattern that we published in the March 12th GMI Weekly. Since then, prices plunged another 30%. Short term, the short banks’ trade feels overdone and bearish sentiment surrounding the issue is still extremely loud. Something to watch...
GMI Chart 2 – Carbon Allowances
Carbon is still messing around ahead of a larger break higher... eventually. If we break above 102, the targeted move is around 140, 60% higher from current levels. Definitely another one to keep an eye on...
GMI Chart 3 – Solana
Solana looks like it’s getting ready to make its next move higher after a period of consolidation following the inverse H&S breakout in April. Solana was a big bet at GMI this year and is up nearly 150% YTD...
GMI Chart 4 – DXY
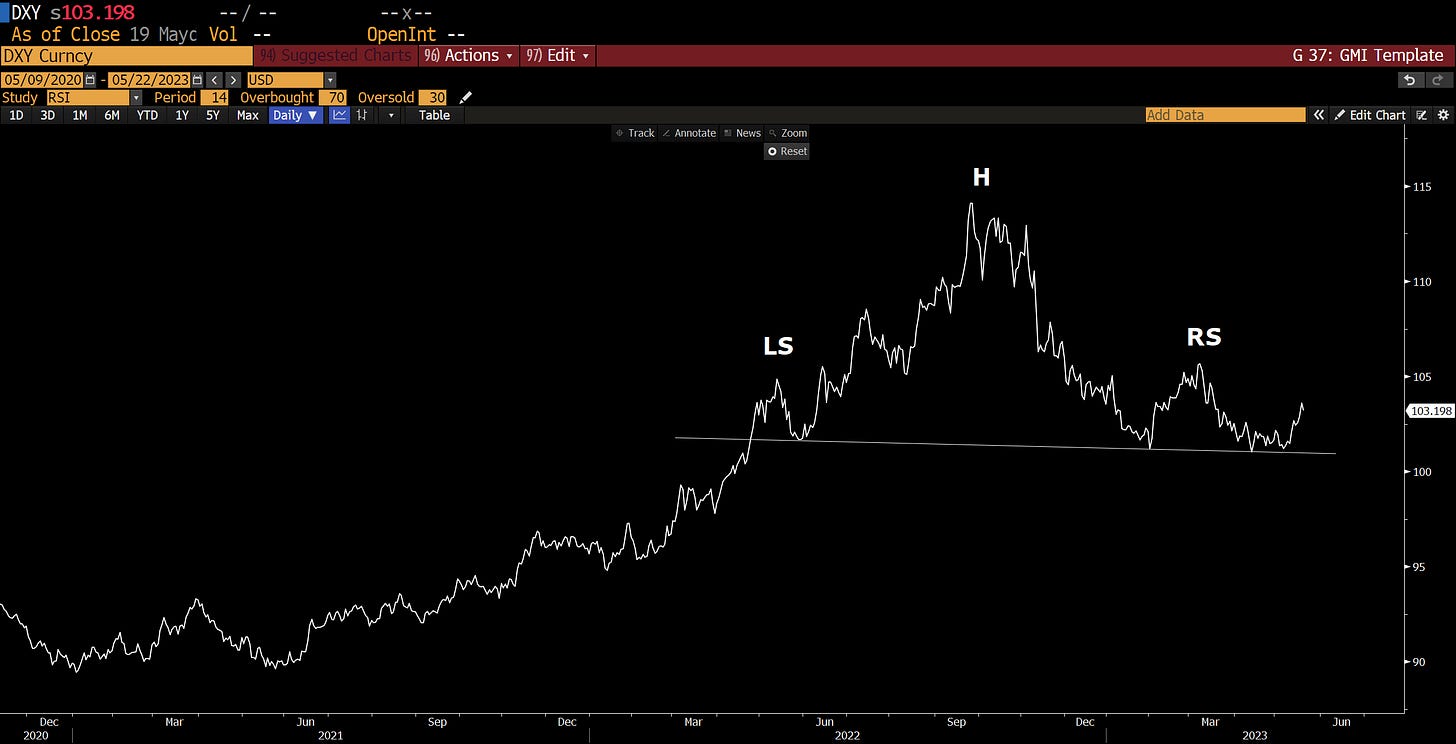
DXY has been moving higher recently but we think that this move is corrective and that we’re in the process of forming a much larger top pattern. We think the next big move higher for the dollar will come in late 2024/early 2025 based on where we think we are in the business cycle...
We also triggered a daily DeMark 9 sell Setup on Friday which has worked well at flagging inflection points in the past, although major resistance is a bit higher at 106. If the DeMark Setup turns into a countdown, this will be the next level to look out for...
The dollar did trade higher on news of the debt ceiling back in 2011. It’s not a perfect fit but contextually makes some kind of sense. Again, we’re not going to rule out a further move higher in DXY, but to us this move is corrective and 106 should hold before we start to work lower again...
GMI Chart 5 – Global Equities
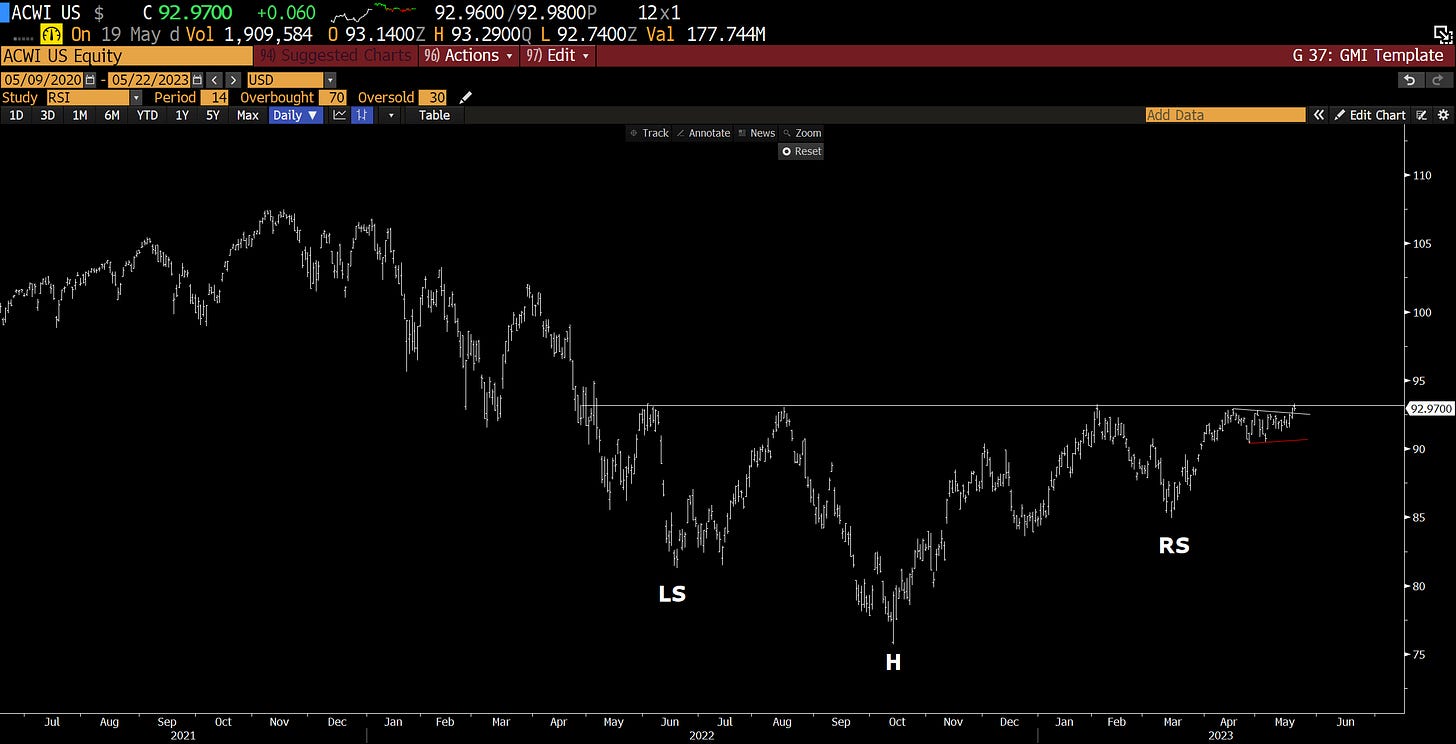
As we’ve discussed in previous GMI Weekly publications, global equities just look like the mirror image of the DXY and appear to be forming a large head-and-shoulders bottom. We’re very close to a potential breakout now and the small bullish pennate that has formed on the right shoulder looks like just the boost needed to get us over the line. If we break 94, the measured move is new highs...
The GMI Big Picture
In GMI we use DeMark indicators a great deal and find them incredibly helpful, especially at inflection points and when the macro really comes together. Back in October of last year, we had a daily DeMark Sequential Countdown 13 buy signal, a weekly 9/13/9 and a monthly 9 buy Setup on the NDX that triggered right on long-term support. This was the signal that we used to get long...
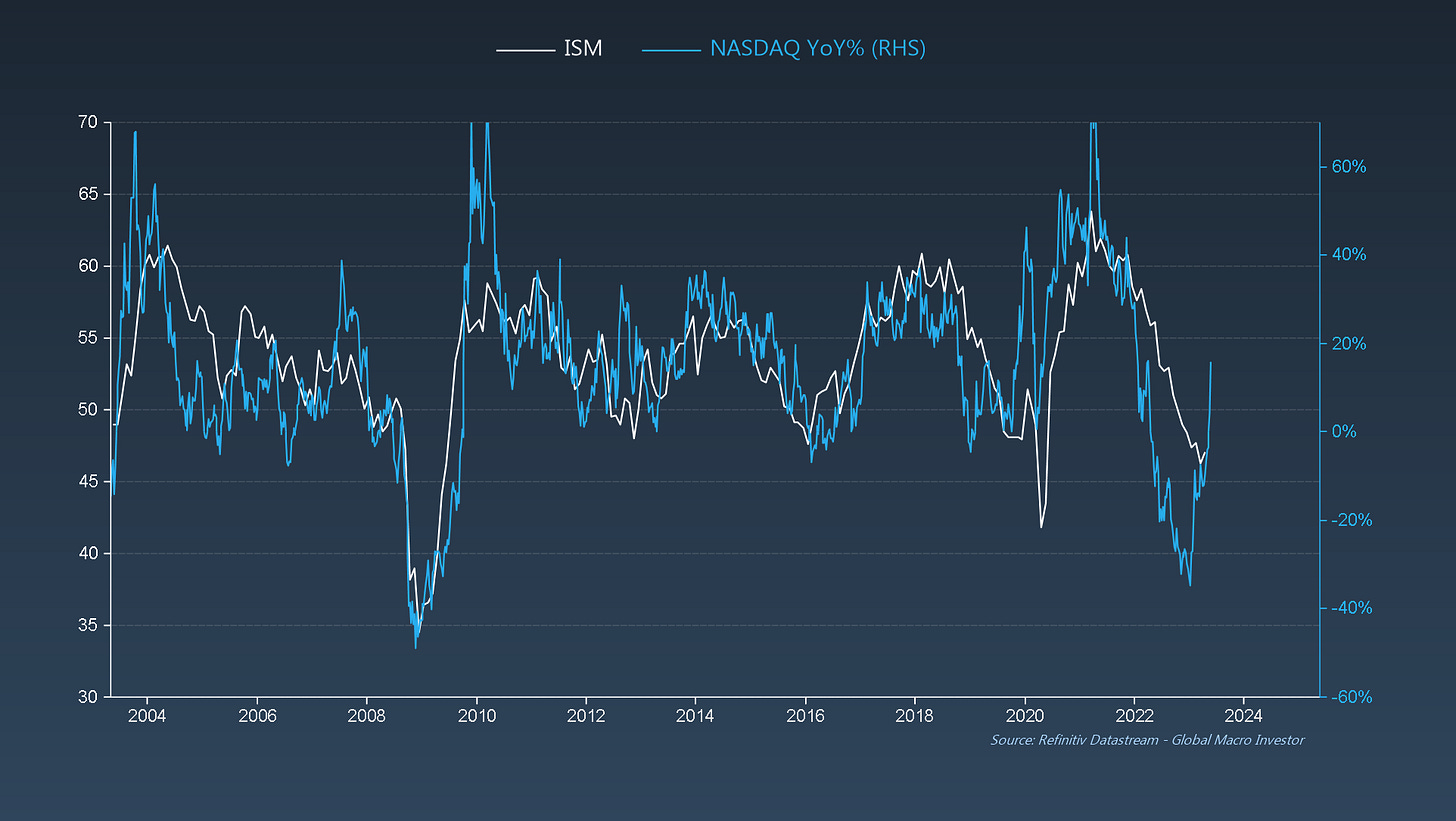
This helped us build additional confidence around our hugely non-consensus call that a recession was already in the price back in October, with the NDX having priced in an ISM of 37.7...
... which amazingly, our GMI Financial Conditions Index was forecasting almost twelve months ago back at our GMI Round Table event in Grand Cayman. Since then, it has inflected sharply higher and this, coupled with a much larger set of macro indicators, was the basis for our more bullish take on 2023...
Our GMI Financial Conditions Index also targets a circa 20% rise in global liquidity by Q4 of this year...
... and, as we’ve discussed many times now, liquidity rising has been the main driver behind the equity re-rating story that we’ve seen off the lows in October...
Nearly everyone we read is still bearish and doesn’t seem to understand that this is all being driven by the rise in liquidity, about which we wrote extensively back in the September GMI Monthly, “The Turn is Near”. This is where we outlined our view that the liquidity cycle was about to bottom and that this would be supportive for risk assets.
And so, despite all the concerns around the debt ceiling, with which we do sympathise and have some hedges on if the shit really does hit the fan, the pain trade to us still feels higher. Speculative positioning in the S&P 500 is at its most short level since May 2007...
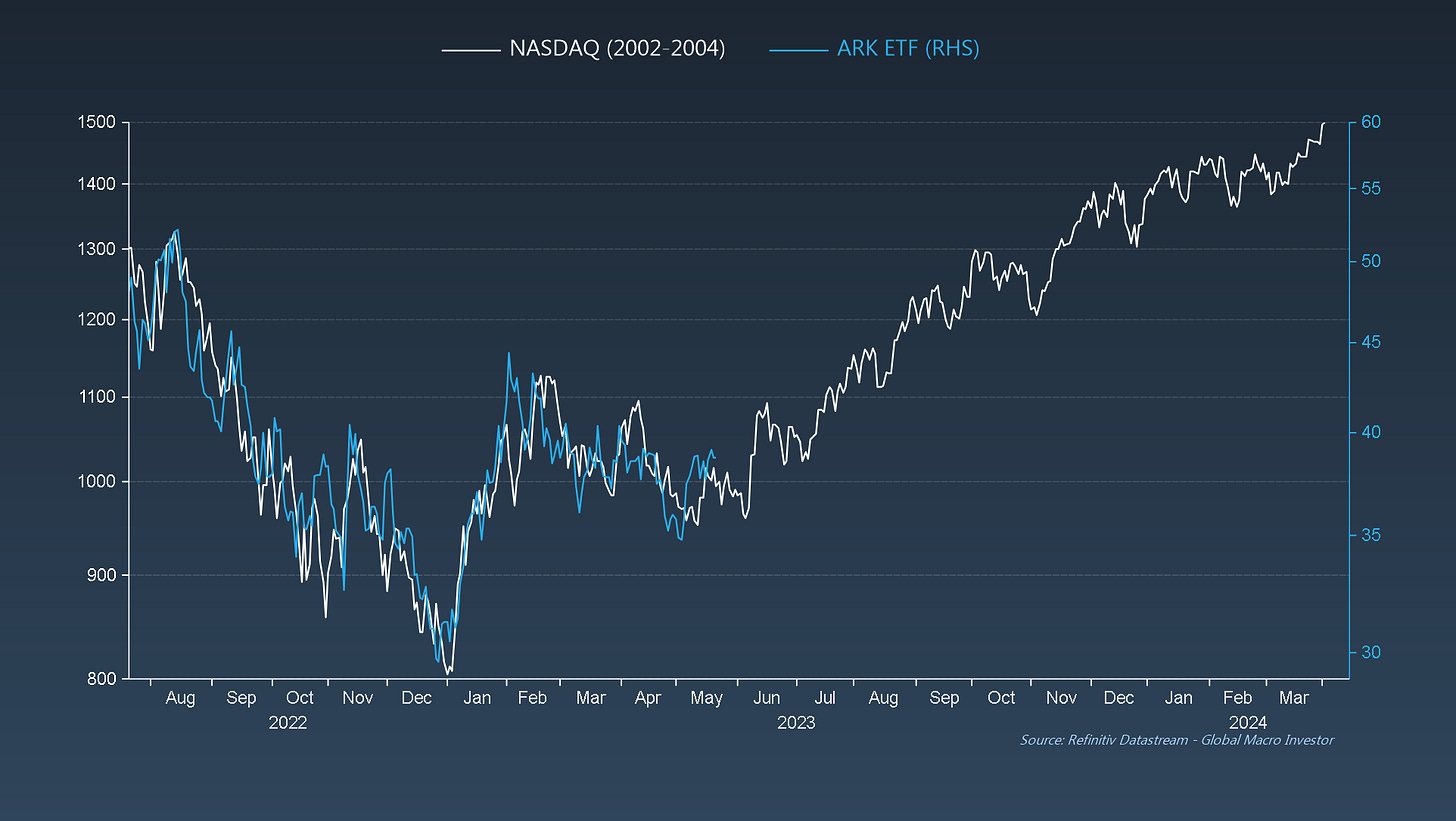
The last chart we’ll leave you to mull over is this chart on the NDX versus ARK ETF analogue from back in 2002. It’s been working extremely well since the middle of last year: 90% correlated over the period, and suggests we’re still headed much higher from here...
As ever, there is much to consider this week.
We’ll be writing our monthly GMI report next weekend and so there will not be an update from us here but we’ll be sharing an excerpt from our most recent report.
Enjoy!
Raoul Pal – CEO, Founder - Global Macro Investor
Julien Bittel – Head of Macro Research - Global Macro Investor


Thanks!
Thanks for sharing