In this week’s newsletter, we’re going to run through the top five macro charts that are on our radar...
As ever, much fuller and more in-depth analysis can be found in Global Macro Investor and Real Vision Pro Macro. Global Macro Investor is our full institutional research service and Real Vision Pro Macro is the sophisticated retail investor service, which is co-authored with leading research firm MI2 Partners.
Let’s dive right in...
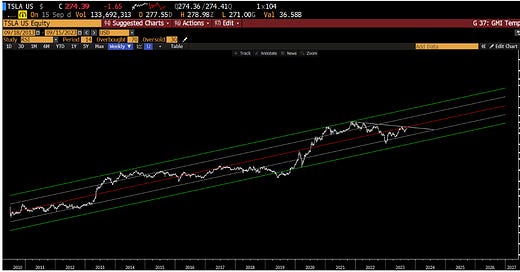
GMI Chart 1 – Tesla Log Channel
Tesla remains one of our favourite stock picks for the next five years. Tesla is at the forefront of everything AI right now and it’s still very early days in our view.
Tesla is the perfect posterchild for the Exponential Age:
· Self-driving Cars
· Green Energy
· Supercomputing
· Big Data
· AI
· Robotics
· Internet of Things (IoT)
· Augmented Reality
In the Exponential Age, the most powerful long-term chart of any major equity is Tesla. The log trend suggests that $4000+ may be on the cards by end of 2027...
At GMI, we added our buy recommendation back in May when the stock was trading at $200, up 37%!
GMI Chart 2 – Tesla Inverse H&S Bottom
Short term, Tesla also looks to have formed a large inverse head-and-shoulders bottom pattern. The measured move from a breakout above the $300 neckline would target $500...
GMI Chart 3 – Trailing 12-Month Global Tesla Deliveries: Q2 2013 – Q2 2023
Despite all this, Tesla remains one of the most hated companies in the world by the ‘cognoscenti’. People confuse their emotions for Elon with emotions for the stock (which is ridiculous). Meanwhile, even if you think it’s “Just a car company, Bro” then this should be important to you...
... as should this...
90% of all Tesla owners say they will never go back to gas cars – that is ludicrously positive. It reminds us very much of Apple in the early 2000s...
... and take a look at this...
The below numbers are also insane; the Cybertruck is a game changer...
GMI Chart 4 – Ethereum
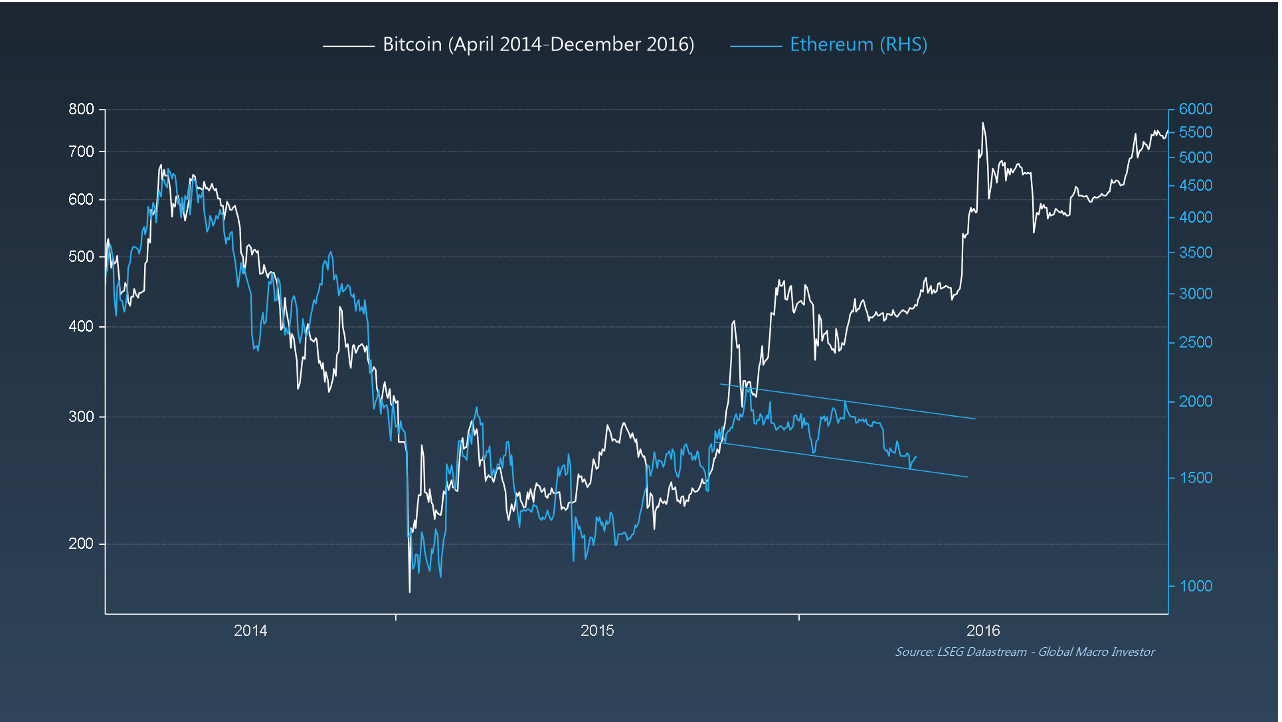
The chart of ETH is still chopping wood but looks like a bull flag...
As discussed previously in GMI Weeklies when looking at historical parallels in our research, the 2016 cycle frequently features: there is rhyme in the following chart of BTC in 2014 to 2016 versus ETH now.
Then, after the sideways period, BTC went vertical...
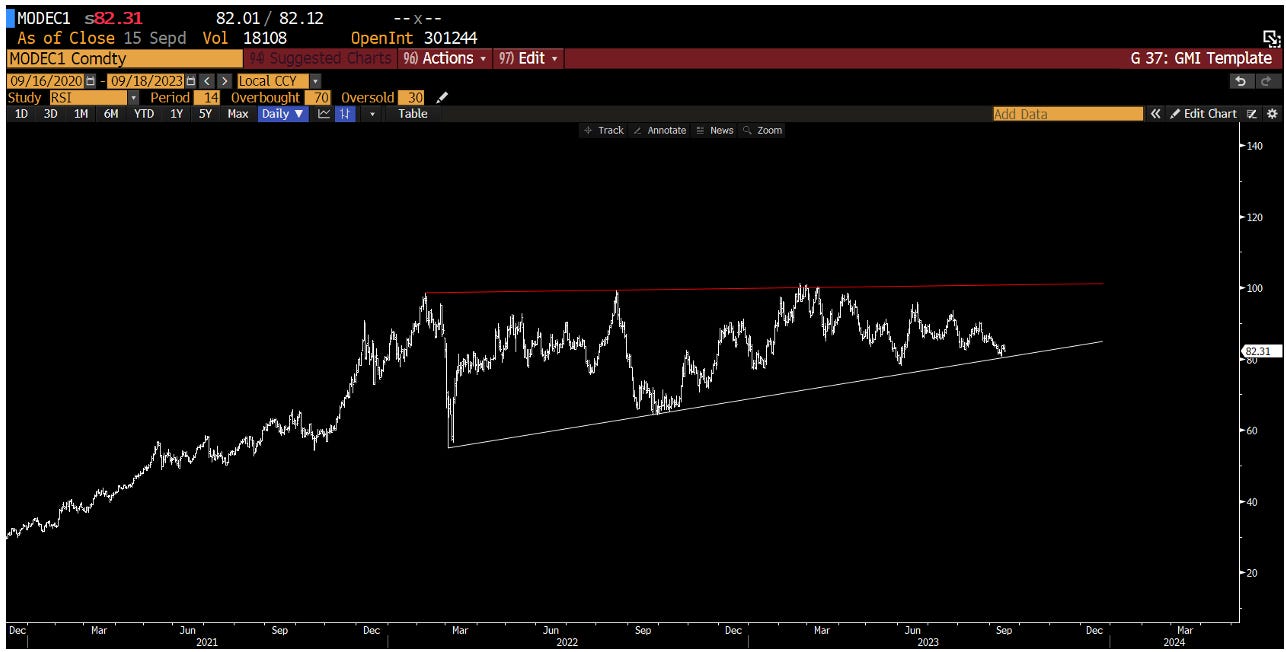
GMI Chart 5 – Carbon
A quick update on carbon. The market is still stuck in a range as some supply has been brought forward and demand has softened due to the energy mix amongst other issues...
We are using the ISM as our best guide to carbon. It lags the ISM by six months, just as the EU business cycle lags the US, but 2024 should be a good year for Carbon as the ISM starts to rally...
The GMI Big Picture
Fed Net Liquidity (FNL) has started to break higher driven by a sharp move lower in the Fed’s Reverse Repo Facility, something that we’ve been expecting at GMI.
Remember, the NASDAQ had front-run Fed liquidity by around $800 billion in the last week of July and this, coupled with some extreme short-term sentiment readings, has meant that equities took a bit of a breather over the summer months...
But it’s also perfectly normal that equities diverge from liquidity at the early stages of a cycle inflection point; they did the same in mid 2019 but the gap is now starting to close with equities trading lower over recent weeks and FNL beginning to rise again...
ETH, on the other hand, hasn’t front-run liquidity and is pretty much trading at “fair value” versus US domestic liquidity conditions, and should just move higher as liquidity starts to rise again into Q4...
Lots to play for still but it’s all down to your time horizon...
Remember, at GMI we turned bullish tech stocks and crypto in Q4 of last year, so we’re less concerned by the sideways chop that we’ve seen over the summer months and Friday’s dump in NDX; essentially, we can afford to sit on our positions because of our entry point and the NDX is still up 40% YTD!
We also have a longer time horizon at GMI given our secular framework and our views around the Exponential Age. Unlike many other macro research subscriptions, we use the business cycle to add to core convictions, and we did exactly that last year.
Good luck out there. That’s it from us this week. See you all soon with another update from GMI.
Remember, this is just a very small fraction of the work we do at GMI...
We cover the biggest secular themes in macro, crypto and technology within a full business cycle framework and also include our comprehensive GMI asset allocation model as well as our GMI model portfolio with an unrivalled, fully-recorded performance going back nineteen years.
You can find the story of GMI here: The Story of Global Macro Investor
If you would like to receive full, ongoing, detailed access to our work at Global Macro Investor (GMI) then you can apply here Global Macro Investor (GMI) or, if that is out of your price range ($18,000+), then a membership to the Real Vision Pro Macro Research Service may be a perfect fit.
Enjoy.
Raoul Pal – CEO, Founder - Global Macro Investor
Julien Bittel – Head of Macro Research - Global Macro Investor


“Account abstractions” & “Stateless Clients” exciting ETH upgrades in the pipeline. https://decrypt.co/197341/one-year-after-the-merge-where-does-ethereum-stand
Raoul, this is excellent content; it amazes me how many keep shorting Tesla when the log regression trend is so strong. They're fighting the dominant trend and will ultimately get wiped out. When I find stocks that exhibit the same characteristics as this trend, I pay very close attention.