In this week’s newsletter, we’re going to run through the top five macro charts on our radar...
As ever, much fuller and more in-depth analysis can be found in Global Macro Investor and Real Vision Pro Macro. Global Macro Investor is our full institutional research service and Real Vision Pro Macro is the sophisticated retail investor service, which is co-authored with leading research firm MI2 Partners.
Let’s dive right in...
GMI Chart 1 – S&P 500 vs. Average Peak in CPI (1950-2018)
Back in early December of last year, we shared this chart with you to help illustrate our more bullish take on 2023 and suggested that a peak in CPI would be supportive for equities and risk assets.
Now, nearly seven months later, even we were surprised at the extent that history (again) has nailed the rally in stocks so far this year...
GMI Chart 2 – US Empire and Philly Price Pressure Composite vs. US CPI YoY%
Also, despite some respectable macro thinkers talking about an imminent turn higher in inflation, we disagree. If anything, short-term inflationary pressures continue to collapse and, according to the June Empire and Philly Fed data, price pressures just fell to their lowest levels since May 2020...
Just to be clear, we continue to anticipate a period of outright price deflation ahead of the next inflationary episode, which we expect to be a story for 2024/2025 not 2023...
GMI Chart 3 – Median Price of Existing One Family Home Sales YoY% vs. CPI: Shelter YoY%
Additionally, we have been warning of a bout of US house price deflation – this is still very much playing out (-3.4% YoY in May) and continues to suggest that a peak in CPI: Shelter is rapidly approaching.
Remember, CPI: Shelter makes up 35% of total CPI and roughly 60% of CPI: Services, so even the major “sticky” sub-components of inflation are setting up for big disinflation over the next eighteen months...
GMI Chart 4 – ISM vs. GMI Price Pressures Lead Index
The fact that inflation indicators are coming down so quickly (as we’ve been expecting) is creating an altogether better environment for growth momentum later this year and this is what the market has been discounting. This is also why we’ve been less focused on current ISM numbers and prefer to look at indicators which are more forward looking – our GMI Price Pressures Index being a prime example...
GMI Chart 5 – ISM vs. Empire and Philly Average
Yes, the manufacturing sector is still weak and the ISM can still drop a little further, however, we think that the ISM will bottom over the summer months and begin to work higher again (but will likely remain in contraction territory for a short period of time before rising above 50 again in late 2023/early 2024). Looking at the average of the Empire and Philly Fed surveys, data in June rose to an eleven-month high!
The GMI Big Picture
As most of you already know by now, it’s been our view that a recession was already in the price of the NDX in October of last year, having priced in an ISM of 37.7 – deep recession territory...
Indeed, when we look at our composite diffusion index, lead indicators globally remain weak BUT...
... historically, a cross below 10% has been an incredible buy signal for equities going back to 1965. Improving from very low levels is what we care about here, that’s when these charts become important...
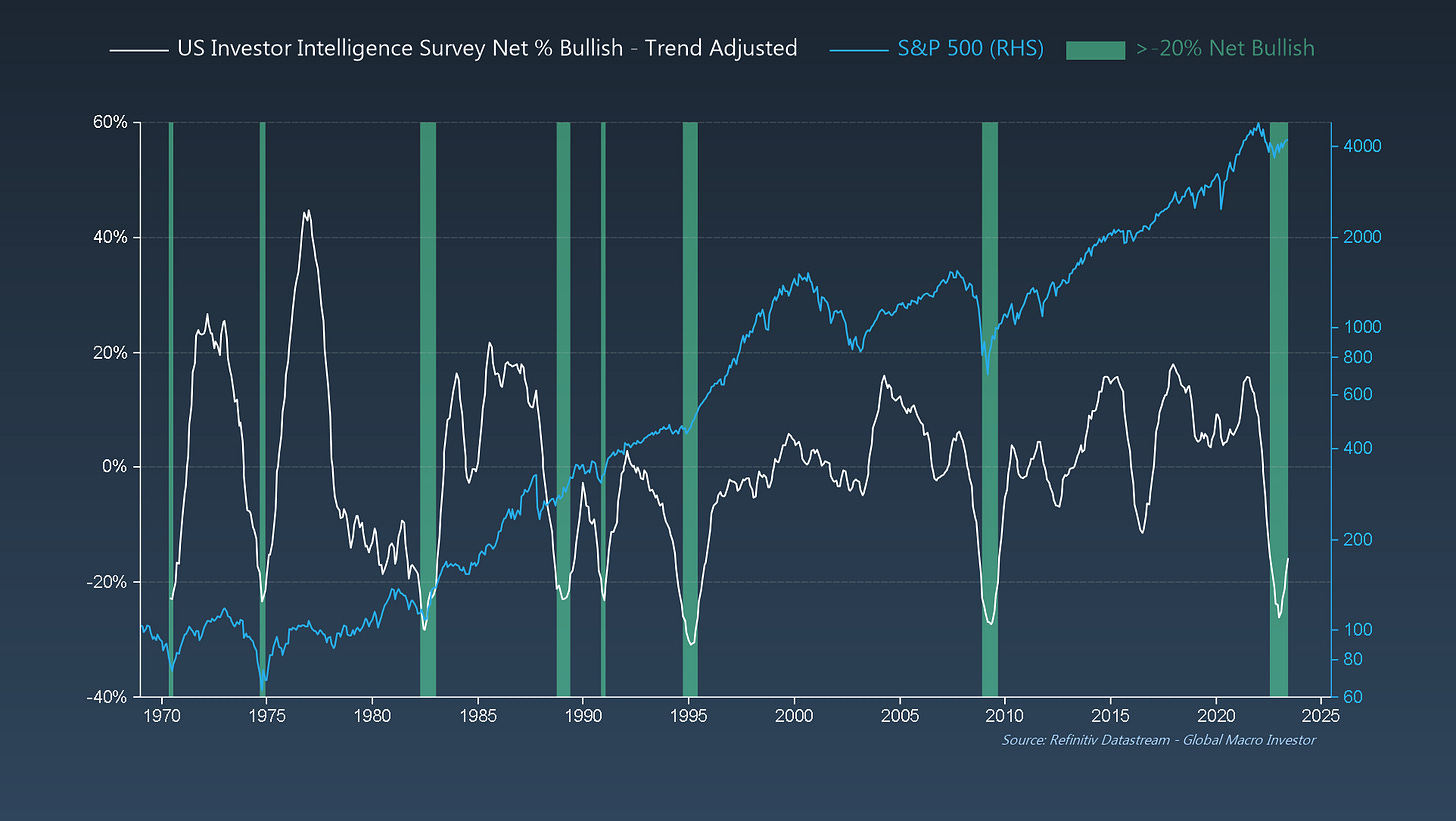
Looking at another long-term chart, sentiment metrics also remain extremely depressed – the strategic buy signal for equities on this indicator came back in January. So far, so good...
Meanwhile, everyone and their dog are still short equities (the world’s most hated rally!) ...
Short-term, the NDX has entered overbought territory versus global liquidity conditions and is likely overdue for a correction some point soon after the monstrous 40% rally off the lows and lots of DeMark counts stacking up...
... but the CRUCIAL point to understand is that liquidity will continue to rise...
Since last October we have been suggesting that the two fastest horses in this race (the debasement and liquidity cycle) will be crypto first, followed by Exponential Age stocks and then tech.
It is playing out perfectly...
To conclude, as the world gets up to speed on our Everything Code hypothesis and global debasement cycles, although we do expect a correction, it is likely to only be short term before the next big leg higher...
That’s it from us this week.
As we’ll be writing our monthly GMI publication next weekend there won’t be an update from us although we will share an excerpt from a recent report.
Enjoy!
Raoul Pal – CEO, Founder - Global Macro Investor
Julien Bittel – Head of Macro Research - Global Macro Investor


Thanks for sharing wisdom @raoul
Excellent!