In this week’s newsletter, we’re going to run through a year-to-date GMI performance review and share some of our thinking around how Q4 will play out...
As ever, much fuller and more in-depth analysis can be found in Global Macro Investor and Real Vision Pro Macro. Global Macro Investor is our full institutional research service and Real Vision Pro Macro is the sophisticated retail investor service, which is co-authored with leading research firm MI2 Partners.
Let’s dive right in...
GMI Chart 1 – YTD Performance in GMI Core Bets: Solana, Ethereum, EA Basket vs the S&P 500
For those of you that have been following us at GMI this year, you will be familiar with our hugely out-of-consensus call back in Q4 of last year to be long risk assets, and our core bets were Solana, Ethereum and our Exponential Age Basket – all of which massively outperformed the S&P 500 so far this year.
Solana is up 176% year-to-date!!!
What gave us the conviction to stick our necks out and go against the crowd in Q4 of last year when everyone else was shouting recession and to be short risk assets?
Let’s run though some of our core thinking at the time...
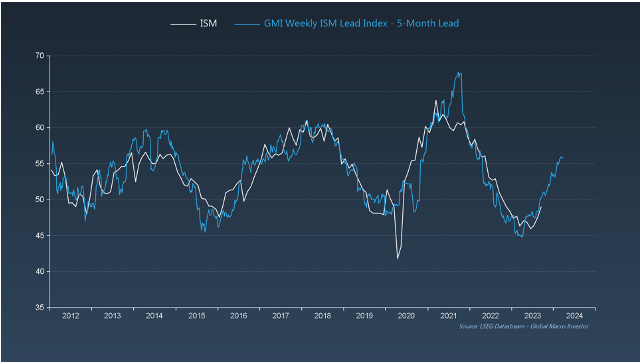
GMI Chart 2 – ISM vs GMI Weekly ISM Lead Index
For starters, our key lead indicators for ISM had started to inflect higher. This put us on high alert for a change in trend and our view was that equities would front-run this process having already discounted a recession in Q4 of last year. The S&P 500 had priced in an ISM of 45, the Nasdaq 37.7...
Additionally, just about everything else we were looking at back then macro-wise, was flashing buy...
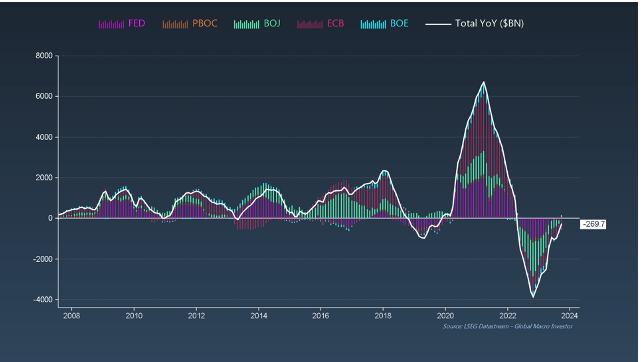
GMI Chart 3 – Global Liquidity Cycle vs GMI Lead Index
We had also been forecasting a turn in the global liquidity cycle, which we published back in our September 2022 GMI Monthly titled “The Turn Is Near” ...
This was correct. Liquidity bottomed one month later in October and continues to rise in YoY terms...
We also expect liquidity will continue rising well into 2024 as global central banks continue to inject liquidity with a lag versus the business cycle (ISM) as a ballast to offset weaker growth momentum...
GMI Chart 4 – US CPI YoY%
We had also been calling for inflationary pressures to ease. At GMI, we presented the case for a peak in US CPI back in May of 2022 during our annual GMI Round Table event in Grand Cayman, on the basis that peak supply chain pressures coupled with a peak in central bank liquidity would equal a peak in CPI.
This was also hugely out of consensus at the time...
Our thinking around the peak in CPI was that equities would prioritise lower inflation data over weaker growth data and climb the wall of worry. This is almost always the case, and this time was no different...
GMI Chart 5 – US Investor Intelligence Survey Net % Bullish vs S&P 500
Last but not least, sentiment on some of our favourite metrics was already as bad as during the global financial crisis back in 2008. Literally EVERYONE was bearish...
Putting all this together, coupled with our larger secular and quantitative frameworks at GMI, we were one of very few paid macro research services that recommended being long crypto in June of last year and to be long technology stocks starting in Q4 of 2022. We were also calling for a bounce in growth momentum when most everyone else was scoring macro extremely negative.
It’s been a good year overall for us at GMI, but the year is not yet finished...
Where are we now?
The GMI Big Picture
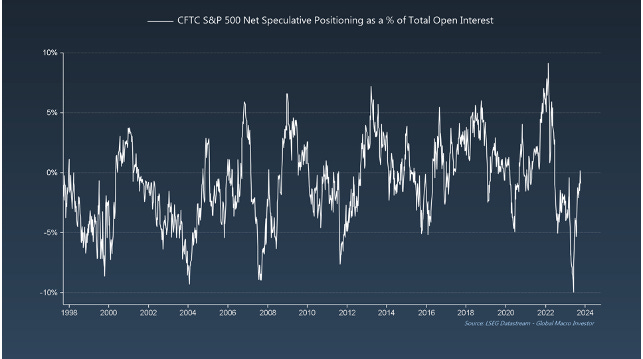
Over the summer months we’ve also seen a sharp reversal in the CFTC data.
The speculative position in the S&P 500 is still net short, but it’s pretty clear that speculators have been using the recent weakness in price action as an opportunity to reduce their short positions. This continues to be a strong contrarian bull argument in our opinion – still plenty of room for a squeeze!
Additionally, don’t forget the Pros have been underweight equities and continue to be so. The recent correction in equities over the summer months has been a godsend for most long-only managers, but any sign that the bull is back, and we’ll see a scramble for risk taking...
Remember, it’s fine for retail investors to sit on the sidelines (cash) and wait to see how things play out, but money managers are mandated to be invested and generate returns; they haven’t been.
We’re also entering what has historically been the most bullish seasonal stretch for equities.
Here is the S&P 500...
... and here is SMH, the VanEck Semiconductor ETF. Wowzer!
In our view, there will be a strong seasonal push to take on some risk heading into year-end, and we want to help you avoid the narrative trap of Twitter and investment bank bearishness, and give you a few charts that may well stop you in your tracks.
Apple looks ready for lift-off soon...
Microsoft has already left the station and is in the process of retesting the breakout zone...
Semiconductors have formed a small bull flag...
... and here is the NDX... a beautiful ABC correction which completes a picture-postcard wedge...
That’s it from us this week. There will be no weekly update from us next week as we are writing the November GMI Monthly.
Good luck out there.
Remember, this is just a very small fraction of the work we do at GMI.
We cover the biggest secular themes in macro, crypto and technology within a full business cycle framework and also include our comprehensive GMI asset allocation model as well as our GMI model portfolio with an unrivalled, fully-recorded performance going back nineteen years.
You can find the story of GMI here: The Story of Global Macro Investor
If you would like to receive full, ongoing, detailed access to our work at Global Macro Investor (GMI) then you can apply here Global Macro Investor (GMI) or, if that is out of your price range, then a membership to the Real Vision Pro Macro Research Service may be a perfect fit.
Enjoy.
Raoul Pal – CEO, Founder - Global Macro Investor
Julien Bittel – Head of Macro Research - Global Macro Investor


What does PRO Crypto not get that the main GMI £17k subscription gets?
I am looking to join Pro Crypto within the next couple of months.
Any chance of posting updated version of S&P500 and global liquidity chart going back to 2008??