In this week’s newsletter, we’re going to run through the top five macro charts on our radar...
As ever, much fuller and more in-depth analysis can be found in Global Macro Investor and Real Vision Pro Macro. Global Macro Investor is our full institutional research service and Real Vision Pro Macro is the sophisticated retail investor service, which is co-authored with leading research firm MI2 Partners.
Let’s dive right in...
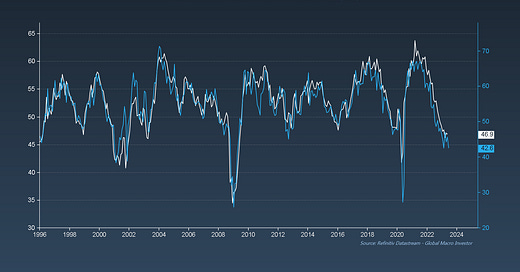
GMI Chart 1 – ISM vs. ISM New Orders
In May, the ISM fell to 46.9 and came in below consensus estimates for 47, which was very much in line with our thinking that the ISM would remain weak over the next 1-2 months and bottom in the summer.
ISM New Orders also came in weaker and is now back down to the lows at 42.6, suggesting that the ISM should come in closer to 45 in June...
GMI Chart 2 – ISM vs. Philadelphia Fed Index
The Philly Fed Index indicates a similar outcome, albeit closer to 40 over the next couple of months...
GMI Chart 3 – ISM vs. GMI Financial Conditions Index
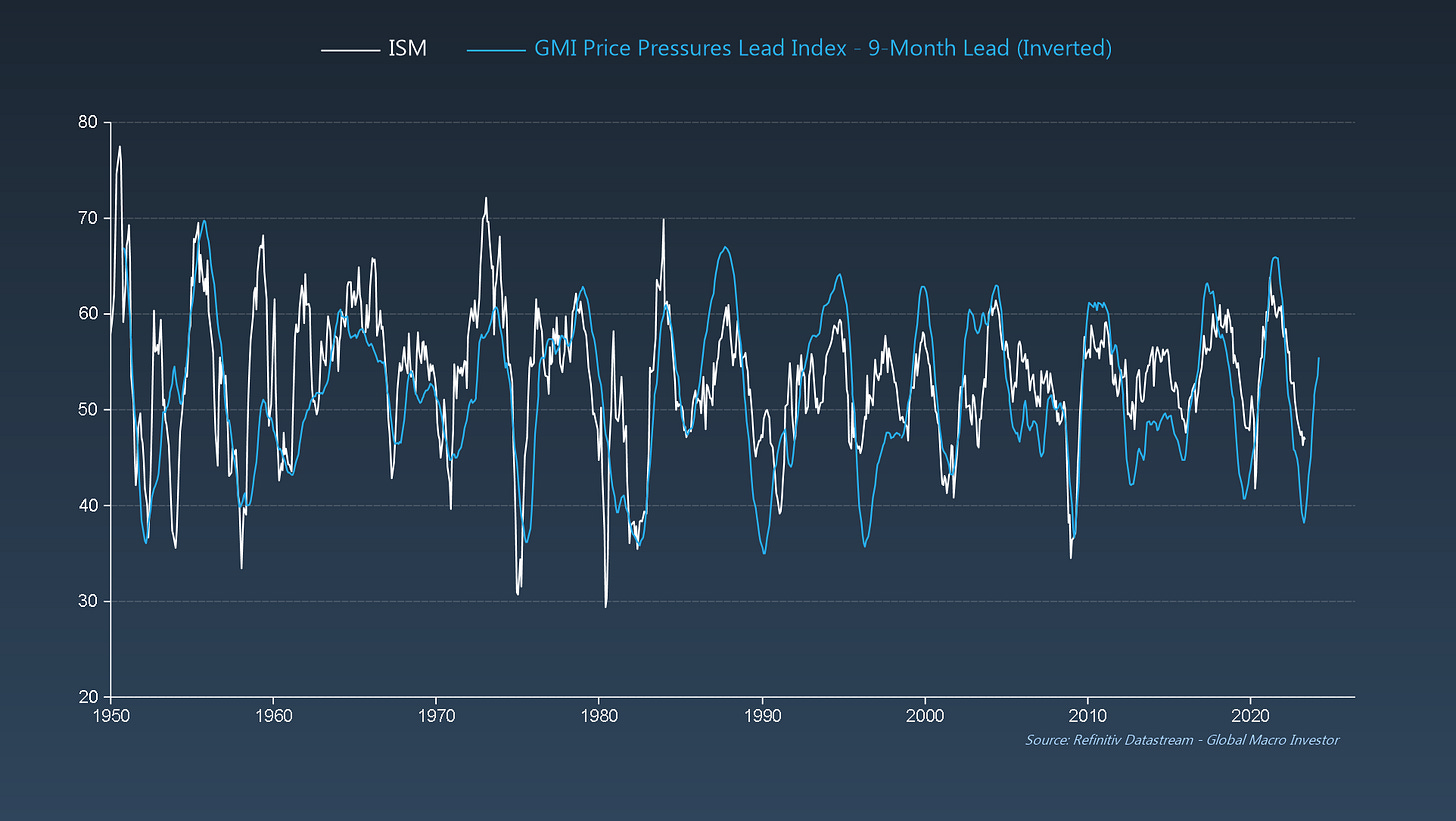
Ditto when looking at our GMI Financial Conditions Index, although crucially it has already bottomed for the cycle and continues to rip higher...
GMI Chart 4 – ISM and S&P 500 Cyclicals vs. Defensives
But here is the really important point, something we’ve been talking about at GMI since October of last year: even IF the ISM does fall to 40, we think it’s already been priced in – Cyclicals vs. Defensives have priced in an ISM of 40 and the NDX (not shown here), 37.7!!! So, therefore we believe that much of the recession that we have been calling for was priced in back in October and this is why equities continue to scream higher on every single negative data point; we’re essentially “climbing the wall of worry” ...
GMI Chart 5 – US Continuing Jobless Claims vs. US Unemployment Rate
We also got the unemployment data for May this week, which surprised to the upside at 3.7%; again something that we’ve been warning about, and this trend is likely to continue. Also, the current degree to which Continuing Claims have risen off the lows is not only 100% recession territory going back to 1967, but also suggests that unemployment can rise around 1% off the lows, so up to around 4.5%...
And the important point with rising unemployment is that just a 0.5% rise off the lows going back to 1954 has been the level where historically, the Fed steps on the brakes and shifts the gear stick from D to R...
The GMI Big Picture
So, unemployment is going to rise but like inflation, employment is extremely lagging and thus a lot of what we’re going to see in terms of labour market weakness in H2, we think is already priced in.
Also, what happened to the 2023 inflation boogie monster? That narrative has been dead wrong...
ISM Supplier Delivery Times just fell to their lowest level since March 2009...
“Wages are sticky, and this will be a problem for the Fed” – this will also be wrong...
... as we’ve been saying for a very long time now, wages aren’t “sticky”, they’re just lagging...
This week we also saw the May Dallas Fed data, and everyone focused on the headline number which came in weaker than expected but again, the market just rallied on the news. The important takeaway from the survey wasn’t the headline number, it was that, just like the Richmond data above, the Dallas Fed data also shows an absolute collapse in wage pressure...
And here’s the important point on inflation weakness:
Yes, the manufacturing sector is still weak and the ISM can still fall to around 40 but the fact that inflation indicators in aggregate are coming down so fast (as we’ve been expecting) is creating an altogether better environment for growth momentum later this year and this is what the market has been discounting. Remember, it’s the market’s job to be forward looking...
And while everyone is still talking about a recession, which we still fully expect to play out in line with our GMI Business Cycle Dominoes framework, our GMI Financial Conditions Index continues to suggest that global liquidity will be up around 20% year-on-year by Q4...
... and will continue to rise well into 2024/2025, even with the TGA rebuild that we think is short-term noise at worst. Yes, there will be some volatility over the summer months, but a) this is not our investment time horizon at GMI and b) we continue to think the low for equities was back in October...
Here is another chart we’ve been showing since February in our GMI Weeklies, where we have been thinking that global equities might be forming a large head-and-shoulder bottom. We said a few weeks back that “We’re very close to a potential breakout now and the small bullish pennate that has formed on the right shoulder looks like just the boost needed to get us over the line.”...
We just broke out above the neckline and the chart still looks extremely bullish. The measured move for a base of this size targets a rise to 109 for the ACWI ETF: new highs...
The last chart we’ll leave you to mull over this week is the following on Tesla, which has just broken out from a multi-month bull flag pattern with a new DeMark Sequential Countdown in play on day 4 of 13, with a wave 3 price objective higher of 280; it’s a super bullish chart...
That’s it from us this week. See you all next week with another update.
Enjoy!
Raoul Pal – CEO, Founder - Global Macro Investor
Julien Bittel – Head of Macro Research - Global Macro Investor


Can't thank you enough for the precious content Raoul! If anyone missed Raoul's conversation with Robert Breedlove, do yourself a favor and watch him explain his entire Macro framework thesis. Brilliant!!!! https://youtu.be/p57elyEWw8U
Waiting for the next episode to start