In this week’s newsletter, we’re going to run through the top five market charts that are on our mind...
As ever, much fuller and more in-depth analysis can be found in Global Macro Investor and Real Vision Pro Macro. Global Macro Investor is our full institutional research service and Real Vision Pro Macro is the sophisticated retail investor service, which is co-authored with leading research firm MI2 Partners.
Let’s dive right in...
GMI Chart 1 – Nasdaq 100 (NDX)
Despite just about everyone sounding the alarm on risk assets and calling for a collapse in equity prices in Q4, the Nasdaq 100 is up over 10% off the October lows and has just broken out...
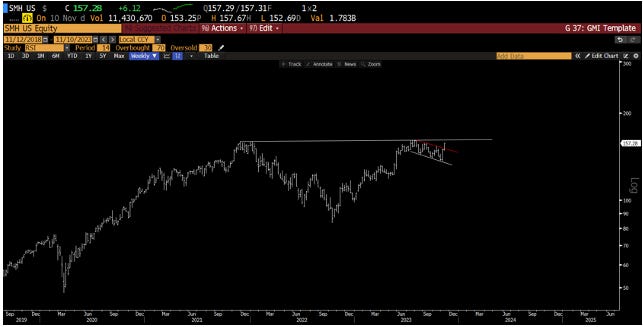
GMI Chart 2 – VanEck Semiconductor ETF (SMH)
Ditto looking at SMH and, if you zoom out, the weekly chart looks like a massive cup and handle chart pattern. A clear break of 164 would target a measured move to 240...
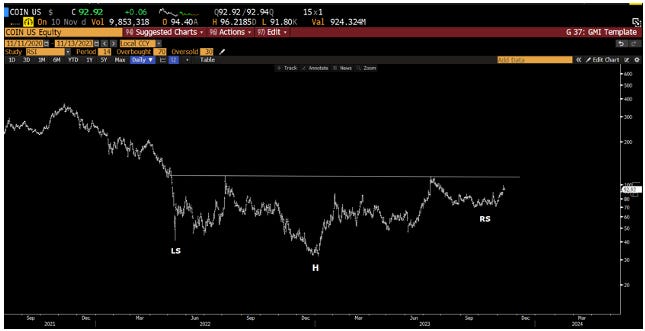
GMI Chart 3 – Coinbase (COIN)
COIN still looks like a huge inverse H&S bottom in the process of forming the right-hand shoulder...
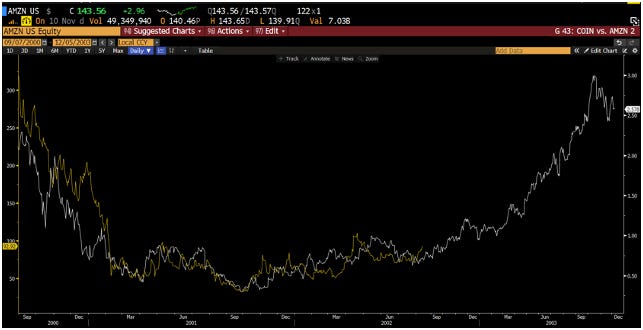
I also can’t stop staring at this analogue of Coinbase vs Amazon back in the early 2000s. Incredible...
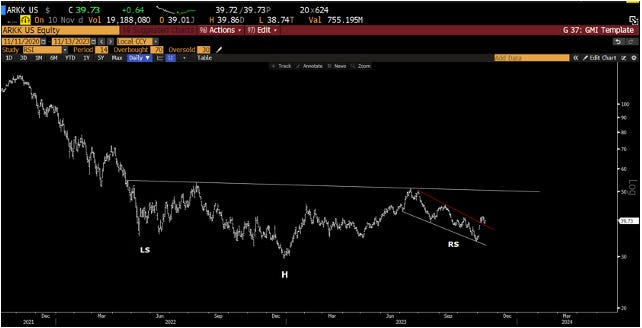
GMI Chart 4 – ARK Innovation ETF (ARKK)
Speaking of head-and-shoulders bottoms, here is ARKK...
GMI Chart 5 – Solana
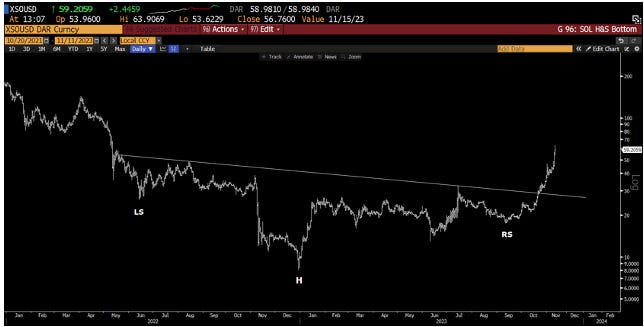
Saving the best for last, SOL broke out from its inverse head-and-shoulders last month and is now up over 475% YTD. This has been one of our core trades at GMI this year and has worked out really well...
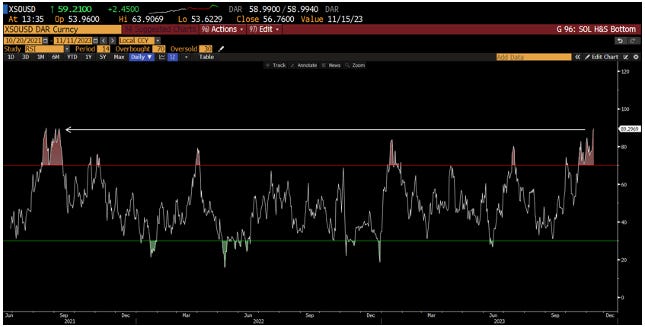
Short-term, SOL is overbought with an RSI of 89 (highest since September 2021), so we should expect to see some selling pressure soon. This should not surprise anyone – we’re up 240% in two months!!!
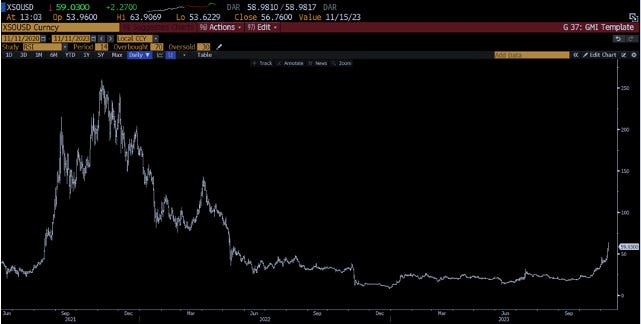
But then you look at this and realise it’s ALL still to play for...
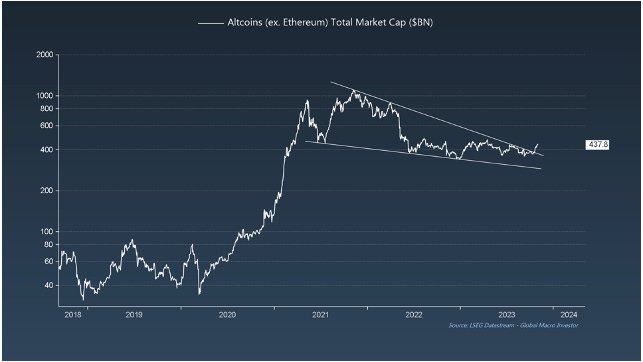
... and this chart too... Blimey...
The GMI Big Picture
Despite huge pushback on our call for macro spring, the green light for us at GMI came back in October of last year where, coupled with our much larger business cycle framework (database of 2,000+ macro charts), our GMI Quantitative Framework was signalling macro winter had reached an extreme reading (80% of countries that we track scoring in this quadrant and highlighted in red below) and that we should be on high alert for a cycle transition to macro spring over the coming 1-3 months...
Here’s a snapshot of what historically has worked best in each macro season. This framework extends MUCH deeper in GMI to cover equity industry groups, commodities, fixed income, FX and even helps navigate the different crypto market regimes i.e., periods of time when Bitcoin dominance is the key theme and when it makes sense to take risk further out the crypto risk curve into Altcoins...
And you can see the year-to-date market profile has been a near-perfect picture of macro spring when compared with the table above in terms of crypto exposure and equity sectors...
What’s the key takeaway here? Don’t get caught up in macro narratives. Focus on the data.
Good luck out there.
Remember, this is just a very small fraction of the work we do at GMI.
We cover the biggest secular themes in macro, crypto and technology within a full business cycle framework and also include our comprehensive GMI asset allocation model as well as our GMI model portfolio with an unrivalled, fully-recorded performance going back nineteen years.
You can find the story of GMI here: The Story of Global Macro Investor
If you would like to receive full, ongoing, detailed access to our work at Global Macro Investor (GMI) then you can apply here Global Macro Investor (GMI) or, if that is out of your price range, then a membership to the Real Vision Pro Macro Research Service may be a perfect fit.
Enjoy.
Raoul Pal – CEO, Founder - Global Macro Investor
Julien Bittel – Head of Macro Research - Global Macro Investor




Particularly awesome charts this week. So excited for what we see from the Solana ecosystem this cycle.
Appreciate the great work Raoul!