In this week’s newsletter, we’re going to run through the top five market charts that are on our mind...
As ever, much fuller and more in-depth analysis can be found in Global Macro Investor and Real Vision Pro Macro. Global Macro Investor is our full institutional research service and Real Vision Pro Macro is the sophisticated retail investor service, which is co-authored with leading research firm MI2 Partners.
Let’s dive right in...
GMI Chart 1 – Copper
Copper has been on our radar for a while now and it feels like it’s setting up for a big move higher...
GMI Chart 2 – Carbon
Carbon is another one we are monitoring, and it too will break higher... eventually...
GMI Chart 3 – EEM (iShares MSCI Emerging Markets ETF)
Emerging market equities have formed a large head-and-shoulders bottom pattern and are in the process of breaking the downtrend off the February 2021 highs – looks bullish...
We like EM equities but still prefer our basket of Exponential Age stocks which have MASSIVELY outperformed all other traditional cyclical assets this year due to the playing out of our Everything Code thesis, which we published in Global Macro Investor earlier this year...
GMI Chart 4 – BBB Credit Spreads
Credit spreads have also started to break lower which is normal given our view on where we are in the cycle...
GMI Chart 5 – Solana vs. Ethereum
Lastly, SOL is up over 30% on the month (+150% YTD!) and has broken the downtrend versus ETH. This is something that we’ve been expecting for a while now and we think this trend will continue higher...
The GMI Big Picture
At the end of the day, traditional reflation trades like EM, commodities, etc., will do well but to our mind, the super massive black hole that is assets linked to the Exponential Age will continue to outperform over time and we think Tesla is at the forefront of this with huge potential upside, possibly more than any other major company...
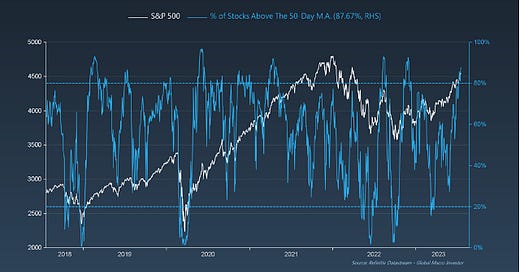
Yes, short-term stocks are overbought with nearly 90% of S&P 500 stocks trading above the 50-day moving average...
... and retail sentiment has improved considerably since we last sent this chart around, back in October of last year, making the case to buy...
So, we do expect some sideways chop and possibly a pullback soon; equities can’t go up in a straight line forever and the rise has been relentless!
We also have a new cluster of daily DeMark 13 sells in place on the S&P 500...
However, we do expect any potential weakness to be bought...
Pros are still uber bearish – literally THE most hated rally ever!!!
... and everyone is still massively short...
Finally, if you zoom out a bit, although sentiment on some of our long-term metrics going back to the 1970s have improved off last year’s low (this was the buy signal for equities), we’re still nowhere near the elevated levels that would make us want to take a more contrarian stance on equities beyond the arguments outlined above for a short breather before the next big push higher...
That’s it from us this week. There will be no weekly update from us next week as we are writing the August GMI Monthly, but we will share something special with you from one of our recent GMI Monthly publications.
Enjoy!
Raoul Pal – CEO, Founder - Global Macro Investor
Julien Bittel – Head of Macro Research - Global Macro Investor


Hi. Still awaiting answers to my questions posed to the weekly newsletter in the past 2 weeks
👍