The GMI Top 5 Weekly Charts That Make You Go Hmmm...
In this week’s newsletter, we’re going to run through the top five crypto charts that are on our radar...
As ever, much fuller and more in-depth analysis can be found in Global Macro Investor and Real Vision Pro Macro. Global Macro Investor is our full institutional research service and Real Vision Pro Macro is the sophisticated retail investor service, which is co-authored with leading research firm MI2 Partners.
Let’s dive right in...
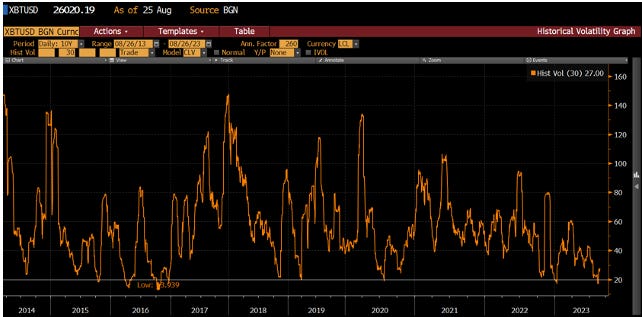
GMI Chart 1 – Bitcoin 30-Day Historical Volatility
Crypto remains our core bet for The Exponential Age and should benefit the most over the long run.
After a strong start to the year (60% to 100% rises), the crypto markets have been completely dead over the summer.
Bitcoin 30-day historical volatility just dipped below 20 for the first time since January of this year...
This 20-level has always produced huge moves over the subsequent two to four months...
April 2016 +83% in 2 months
October 2016 +85% in 2 months
March 2019 +214% in 3 months
July 2020 +102% in 4 months
January 2023 +85% in 3 months
GMI Chart 2 – Bitcoin Weekly Bollinger Bands
Bollinger Bands are another way at looking at the super-low volatility environment.
Bitcoin Bollinger Bands are currently the tightest on record. Only one other month historically have we ever been below 25 which was back in April 2016.
Back then, Bitcoin went on to rally 44x into the 2017 high...
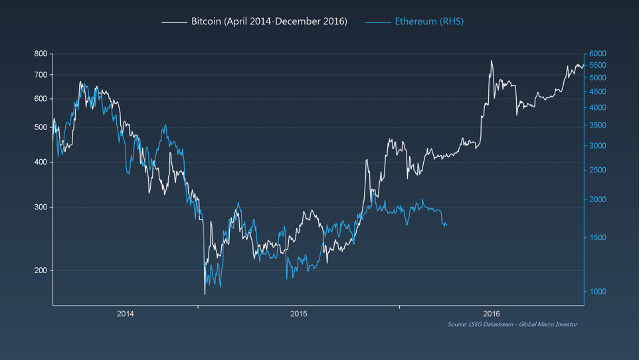
GMI Chart 3 – Bitcoin vs. Ethereum Analog
When looking at historical parallels in our research, the 2016 cycle frequently features; there is rhyme in the following chart of BTC in 2014 to 2016 versus ETH now.
Back then, after the sideways period, BTC went vertical...
GMI Chart 4 – Ethereum
Additionally, as we highlighted last week, ETH also seems to be forming a large bull flag pattern...
GMI Chart 5 – Ethereum/Bitcoin YoY% vs. ISM
Lastly, the ISM continues to suggest that ETH is about to outperform BTC and it should kick off in Q4...
The GMI Big Picture
In global macro, it’s always very important to zoom out and focus on the big picture.
The BIG picture is that crypto wallets grew 40% in 2022, a year when prices fell 75%!
When we plug that into our crypto adoption chart (using the model of past internet adoption growth) the trend is firmly in place to hit 1.2bn users this cycle – and will reach 5bn users by 2030!
ETH has seen much faster adoption rates than BTC...
We also know that Alts are currently at levels versus BTC that usually produce huge outperformance...
Take a look at the previous two instances that fell below the 10% threshold on the previous chart and then propelled back above the 10% line:
In September 2019, ETH went on to outperform BTC by 132% over the subsequent twelve months.
In January 2021: +220%
In July 2023: +3% (so far...)
Good luck out there. That’s it from us this week. See you all next week with another update.
Remember, this is just a small fraction of the work we do at GMI...
We cover the biggest secular themes in macro, crypto and technology within a full business cycle framework and also include our comprehensive GMI asset allocation model as well as our GMI model portfolio with an unrivaled, fully-recorded performance going back nineteen years.
You can find the story of GMI here: The Story of Global Macro Investor
If you would like to receive full, ongoing, detailed access to our work at Global Macro Investor (GMI) then you can apply here Global Macro Investor (GMI) or, if that is out of your price range ($18,000+), then a membership to the Real Vision Pro Macro Research Service may fit perfectly.
Enjoy.
Raoul Pal – CEO, Founder - Global Macro Investor
Julien Bittel – Head of Macro Research - Global Macro Investor


What effect will the collapse of binance and tether have on BTC and ETH?
Great charts!