


The GMI Top 5 Weekly Charts That Make You Go Hmmm...

In this week’s newsletter, we’re going to run through the top five market charts that are on our radar...
As ever, much fuller and more in-depth analysis can be found in Global Macro Investor and Real Vision Pro Macro. Global Macro Investor is our full institutional research service and Real Vision Pro Macro is the sophisticated retail investor service, which is co-authored with leading research firm MI2 Partners.
Let’s dive right in...
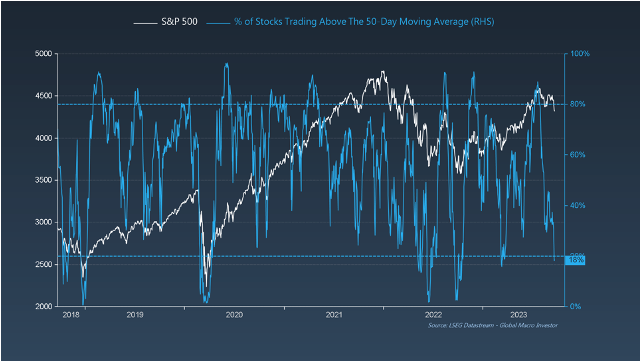
GMI Chart 1 – S&P 500: % of Stocks Above the 50-Day Moving Average
It’s been a rough few weeks for equity investors, with major US indices like the S&P 500 and the Nasdaq being down -4% and -5% respectively so far in September. Given the extent to which prices have already come down, equities are however, back in oversold territory.
When looking at the % of Stocks Trading Above the 50-Day Moving Average, we just fell below the 20% threshold for the first time since March, and before that, the major lows in October of last year.
We flagged this metric back in late July when the market was looking a tad overbought and sentiment extreme, arguing that we might see a bit of sideways chop and possibly a correction over the summer months. Now, this complex has nearly completely unwound with just 18% of stocks currently trading above the 50DMA...
GMI Chart 2 – S&P 500: % of Stocks Trading With 14-Day RSI <30
Another way to analyse the extent to which stock market internals are overbought/oversold is to look at the % of Stocks Trading With 14-Day RSI <30. Currently, nearly 20% of the stocks included in the S&P 500 are trading with an RSI below 30.
We’re also rapidly approaching a confluence of important support levels for the S&P 500: the 200-Day Moving Average and key technical support around 4,200 – this is the level to keep an eye on...

GMI Chart 3 – S&P 500: DeMark Indicators
We also have a cluster of daily DeMark 13 buy signals in place and, should prices continue lower over the course of next week (say down to the 4,200 level mentioned above), we will also trigger a 9/13/9 buy signal (in DeMark language an important indicator for a potential reversal in price action) ...

GMI Chart 4 – MSCI ACWI ETF (Global Equities)
We have also been flagging this chart of global equites all year and back in March highlighted the potential for this to be a large inverse head-and-shoulders bottom pattern.
We’ve since broken out above the neckline and we’re currently in the process of retesting the breakout level, which is typical in technical analysis.
A good rule of thumb when scanning charts using technical analysis is to use the 200-day moving average as a trend filter. Generally speaking, price action above the long-term average is a good time to scan for bullish continuation chart patterns and, below the long-term average, bearish continuation chart patterns.
Having said that, the neckline is currently bang in line with the 200DMA and it seems to us that we’ve formed a small bullish falling wedge pattern...

Additionally, similar to the S&P 500, we have a cluster of daily DeMark 13 buy signals triggering at the minus two standard deviation oversold level using the log regression channel...

GMI Chart 5 – ISM vs GMI Weekly ISM Lead Index
Last but not least, remember that our lead indicators for the ISM have been pointing higher for months now and suggest that the ISM should be nearer 55 by mid-Q1 of next year. In our opinion, this is a strong tailwind for risk assets heading into 2024...

The GMI Big Picture
Ok, time for a big picture sentiment check.
It’s amusing to see that after just a 5% correction in the Nasdaq in September, the bears are already trying to take a victory lap. Even after the summer lull in stocks, the Nasdaq is still up 33% year-to-date!

Additionally, don’t forget that the Pros have been underweight equities all year long and continue to be extremely downbeat in September according to the BofA Fund Manager Survey.
It’s fine for retail investors to sit on the sidelines (cash) and wait to see how things play out, but money managers are mandated to be invested and generate returns; they haven’t been.
There will be a strong push heading into the positive Q4 seasonal patch (I have a chart to show you on this later) to take some risk as most big institutional managers that I speak with haven’t been long this year and are massively underperforming their benchmarks. In our view, this should be the floor as to how far equities can fall from here...

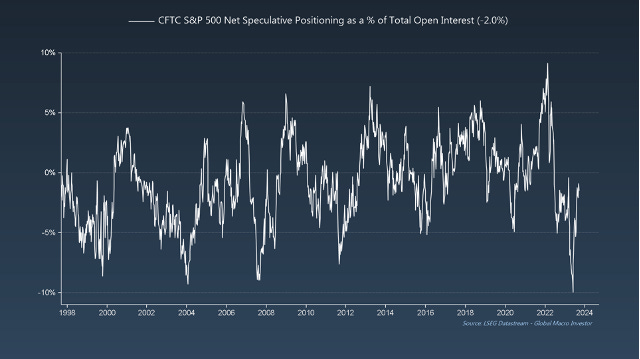
Over the summer months we’ve also seen a sharp reversal in the CFTC data.
The speculative position in the S&P 500 is still net short and it’s pretty clear that speculators have been using the recent weakness in price action as an opportunity to reduce their short positions. This continues to be a strong contrarian bull argument in our opinion – still plenty of room for a squeeze!
The last chart we’ll leave with you to mull over is the chart on S&P 500 Seasonality. Historically speaking, we’re nearing the most bullish seasonal stretch for equities. Food for thought...

Good luck out there. That’s it from us this week. See you all soon with another update from GMI.
Remember, this is just a very small fraction of the work we do at GMI...
We cover the biggest secular themes in macro, crypto and technology within a full business cycle framework and also include our comprehensive GMI asset allocation model as well as our GMI model portfolio with an unrivalled, fully-recorded performance going back nineteen years.
You can find the story of GMI here: The Story of Global Macro Investor
If you would like to receive full, ongoing, detailed access to our work at Global Macro Investor (GMI) then you can apply here Global Macro Investor (GMI) or, if that is out of your price range ($18,000+), then a membership to the Real Vision Pro Macro Research Service may be a perfect fit.
Enjoy.
Raoul Pal – CEO, Founder - Global Macro Investor
Julien Bittel – Head of Macro Research - Global Macro Investor
Will you be posting an updated version of global liquidity vs S&P500/stock market anytime soon, please?
Great thoughts to spend a sunday evening analysing!