In this week’s newsletter, we’re going to run through the top five macro charts that are on our mind...
As ever, much fuller and more in-depth analysis can be found in Global Macro Investor and Real Vision Pro Macro. Global Macro Investor is our full institutional research service and Real Vision Pro Macro is the sophisticated retail investor service, which is co-authored with leading research firm MI2 Partners.
Let’s dive right in...
GMI Chart 1 – ISM vs. Bitcoin Implied ISM Pricing
Crypto, as an asset class, is still widely misunderstood.
The narrative that is now – and has been for some time – is that crypto is just a speculative asset that bears no real resemblance to the economy and therefore, unlike many other assets (equities, credit, fixed income, commodities, etc.) is not governed by the same economic fundamentals and is therefore difficult to assess within a traditional global macro framework. Of course, like most assumptions around crypto today, this is completely false.
Below you will find a chart of ISM (our preferred barometer for the business cycle) versus what Bitcoin is currently discounting in terms of where we are in the cycle. As you can tell, the two are very closely correlated and Bitcoin is even leading as you would expect...
GMI Chart 2 – Bitcoin YoY% vs. Global M2 YoY%
The fact that Bitcoin has a lead over ISM is being driven by the turn higher in the liquidity cycle, which bottomed last year and continues to rise in year-on-year terms. This is why we have seen such a face-ripping rally in crypto and tech stocks year-to-date: it’s all down to a turn higher in liquidity...
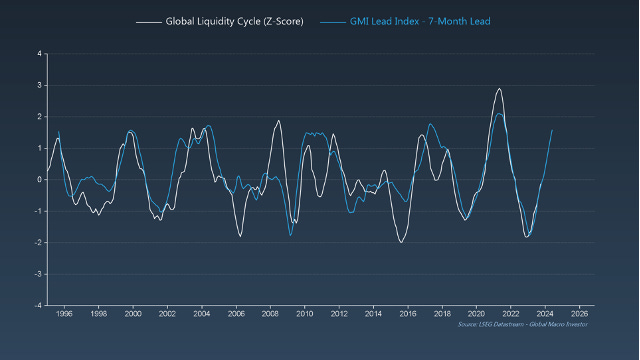
GMI Chart 3 – Global Liquidity Cycle vs. GMI Lead Index
Our models for the global liquidity cycle bottomed back in October of last year and continue to suggest an upward trajectory well into 2024...
GMI Chart 4 – Fed Net Liquidity vs. Ethereum
Recently, many have also been surprised by the push higher in Ethereum. Here again, it’s all about the liquidity cycle and we expect Fed Net Liquidity to continue higher in 2024 as the Reserve Repo Facility drains to zero, which then prompts the Fed to resort to the use of the balance sheet...
GMI Chart 5 – Bitcoin (April 2014 - December 2026) vs. Ethereum Today
Additionally, if you’ve been following these GMI weeklies, you will know that we’ve been calling for a breakout of the bull flag pattern in Ethereum, which has been closely mirroring Bitcoin back in 2016...
The GMI Big Picture
Following last week’s negative surprise in October US CPI and PPI numbers, macro is back to scoring in the Macro Spring regime within our framework. This is where we have spent the bulk of 2023 and is the preferred environment for long duration equity plays and liquidity sensitive assets like crypto, which is why tech stocks and crypto have been bar far your best bet in terms of asset allocation picks YTD...
Another element that risk assets have been picking up on recently is that after a brief tightening in financial conditions over the summer months driven by a stronger dollar and higher commodity prices, financial conditions have been easing since October despite the push higher in 10-Year Yields to 5%.
Remember, financial conditions can ease with the same level of rates because you need to think about everything in terms of cycles (i.e., the rate of change)...
As we’ve been expecting, the Nasdaq has broken out from its bull flag chart pattern...
... and we see the same when looking at Semis...
It feels as if Apple wants to retest the highs around 198; there is currently a DeMark Sequential Countdown in play on day 5 of 13 higher...
In addition, Amazon is very close to a key breakout following the inverse head-and-shoulders bottom pattern that we’ve been flagging for a couple of months now. A weekly close above 148 is the signal to watch out for. We might not do it on this attempt and instead form another right shoulder to complete a smaller inverse head-and-shoulders pattern before the big breakout. Something to keep an eye on...
That’s it from us this week. Good luck out there.
Remember, this is just a very small fraction of the work we do at GMI.
We cover the biggest secular themes in macro, crypto and technology within a full business cycle framework and also include our comprehensive GMI asset allocation model as well as our GMI model portfolio with an unrivalled, fully-recorded performance going back nineteen years.
You can find the story of GMI here: The Story of Global Macro Investor
If you would like to receive full, ongoing, detailed access to our work at Global Macro Investor (GMI) then you can apply here Global Macro Investor (GMI) or, if that is out of your price range, then a membership to the Real Vision Pro Macro Research Service may be a perfect fit.
Enjoy.
Raoul Pal – CEO, Founder - Global Macro Investor
Julien Bittel – Head of Macro Research - Global Macro Investor


GMI is literally a life hack.
Can you post a chart of global central bank liquidity vs stocks starting from 2009 ?