In this week’s newsletter, we’re going to run through the top five macro charts that are on our radar...
As ever, much fuller and more in-depth analysis can be found in Global Macro Investor and Real Vision Pro Macro. Global Macro Investor is our full institutional research service and Real Vision Pro Macro is the sophisticated retail investor service, which is co-authored with leading research firm MI2 Partners.
Let’s dive right in...
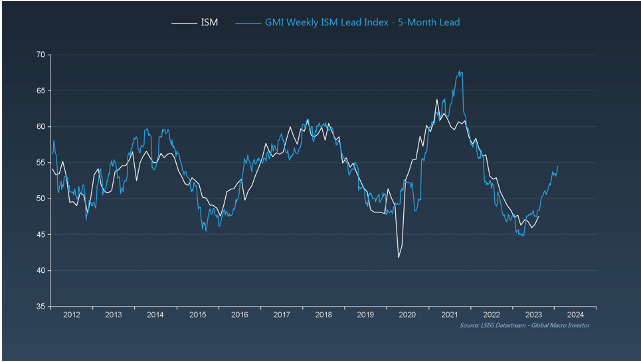
GMI Chart 1 – ISM vs. GMI Weekly ISM Lead Index
For those of you that have been following us at GMI this year, you will know that we’ve been very vocal around a cyclical inflection point higher in ISM and that the markets would front-run this process.
We turned bullish on equities back in Q4 of last year and our lead indicators for ISM are still pointing higher. Our Weekly ISM Lead Index is currently suggesting that ISM will be nearer 55 by early Q1 2024...
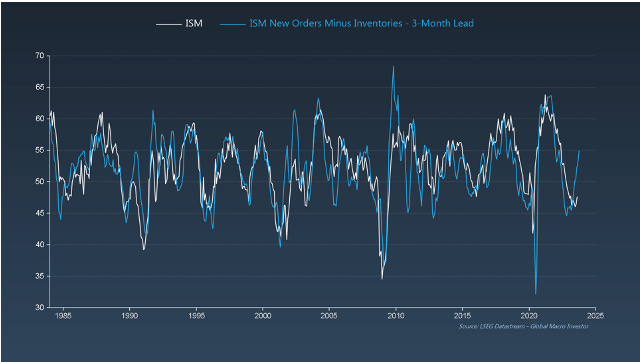
GMI Chart 2 – ISM vs. ISM New Orders Minus Inventories
ISM data for the month of August came out last week and came in slightly higher than expectations at 47.6. More importantly, the trend in ISM New Orders minus Inventories continues higher and points to stronger ISM prints over the coming months.
It’s also important to remember that the discount window for equities versus current ISM is +3 months, so coincident with ISM New Orders minus Inventories and consistent with our GMI Business Cycle Dominoes framework, something I’ll circle back to later...
GMI Chart 3 – GMI Late-Cycle Checklist
The late-cycle narrative has also become extremely pervasive in recent months.
We have written before about the period ranging from Q4 2021 – Q1 2022. To us, this was classic late cycle and was the correct time to take a more negative stance on the market and risk assets. In fact, 100% of the indicators included in our checklist were flagging a late-cycle environment with the total score ranking in the 94th percentile vs the current 44% reading today.
GMI Chart 4 – US Nonfarm Payrolls MoM vs. GMI NFP Model
In terms of the labour market, our lead indicators have deteriorated considerably over recent months and continue to suggest that the Employment Domino is now in full swing...
Additionally, beneath the surface something else has been going on, hinting that all is not what it seems this year in terms of labour market resilience. Nonfarm payrolls have been revised lower every single month this year – that’s seven consecutive months! The June figure is particularly striking: it was revised lower by 104k from first release; again, something that we’ve been expecting.
Back in June, consensus was looking for 230k with the initial release coming in at 209k, so a negative surprise, albeit a small one. In July, the June number was revised lower to 185k, whoops! But here’s the real shocker: in August the June number was revised down again to 105k! Imagine if NFPs came in at the actual 105k back then vs the initial release of 209k. That would have meant an undershoot of 125k!
GMI Chart 5 – GMI Business Cycle Dominoes
However, all of this makes sense within our GMI Business Cycle Dominoes framework.
Employment data, CPI, Wages, and everything else to the left-hand side of ISM at T=0 and in white, are all lagging indicators of the economy. Remember, it’s our job as investors to live in the future and focus on lead indicators of the economy because the equity market tends to be forward looking...
The GMI Big Picture
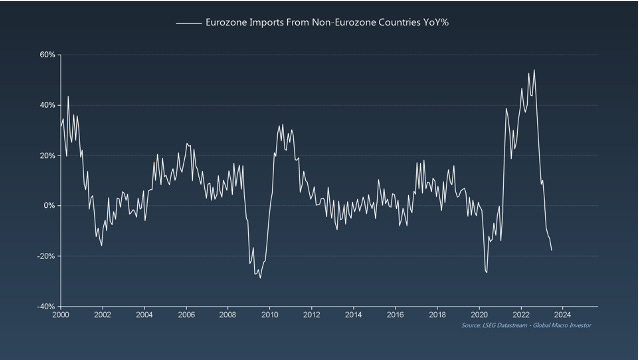
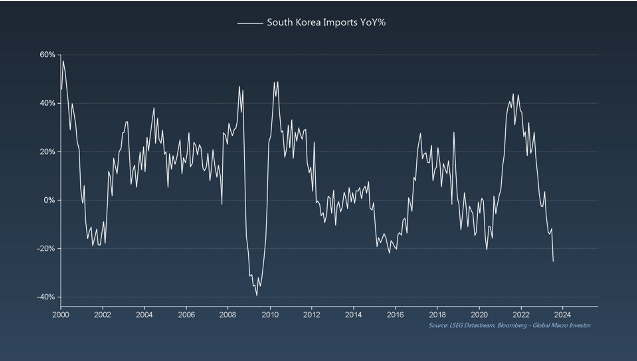
A lot of people we read continue to suggest that other factors outside the US will continue to weigh on US growth, such as weak foreign demand. But foreign demand has already totally collapsed!!!
Europe is probably already in recession...
... as is South Korea...
But again, import data is coincident economic data. It’s ALL about the GMI Business Cycle Dominoes.
Lead indicators are improving from very low levels; coincident data will soon start to bottom, and lagging economic data like unemployment and wages should continue to deteriorate (for now). This is what’s happening here and it’s playing out in real time.
We actually think we should be looking for a pick-up in foreign demand over the next three to six months...
This does not mean that the US will avoid a recession later this year; remember, GDP data lags the ISM by one quarter. However, our view at GMI is that recession or not, lead indicators are improving and, as far as we’re concerned, the bulk of the recession (if it comes) was already in the price of equities last year: S&P 500 priced in an ISM of 45, NDX an ISM of 47.7...
So, here’s the bottom line:
With inflation under control, it’s now all about labour market weakness in H2, which will unlock the next wave of liquidity. Our window for fireworks is Q4, but it may come even earlier. Tick-tock...
Good luck out there. That’s it from us this week. See you all soon with another update from GMI.
Remember, this is just a very small fraction of the work we do at GMI...
We cover the biggest secular themes in macro, crypto and technology within a full business cycle framework and also include our comprehensive GMI asset allocation model as well as our GMI model portfolio with an unrivaled, fully-recorded performance going back nineteen years.
You can find the story of GMI here: The Story of Global Macro Investor
If you would like to receive full, ongoing, detailed access to our work at Global Macro Investor (GMI) then you can apply here Global Macro Investor (GMI) or, if that is out of your price range ($18,000+), then a membership to the Real Vision Pro Macro Research Service may fit perfectly.
Enjoy.
Raoul Pal – CEO, Founder - Global Macro Investor
Julien Bittel – Head of Macro Research - Global Macro Investor


I think you had said NDX was pricing ISM of 37.7 and not 47.7 as you have mentioned in this article. Is this just a typo? Thanks
Love it.