In this week’s newsletter, we’re going to run through some of this week’s important data releases and give our initial thoughts on the recent collapse of Silicon Valley Bank...
As ever, much fuller and more in-depth analysis can be found in Global Macro Investor and Real Vision Pro Macro. Global Macro Investor is our full institutional research service and Real Vision Pro Macro is the sophisticated retail investor service, which is co-authored with leading research firm MI2 Partners.
First the economic data. Let’s dive right in...
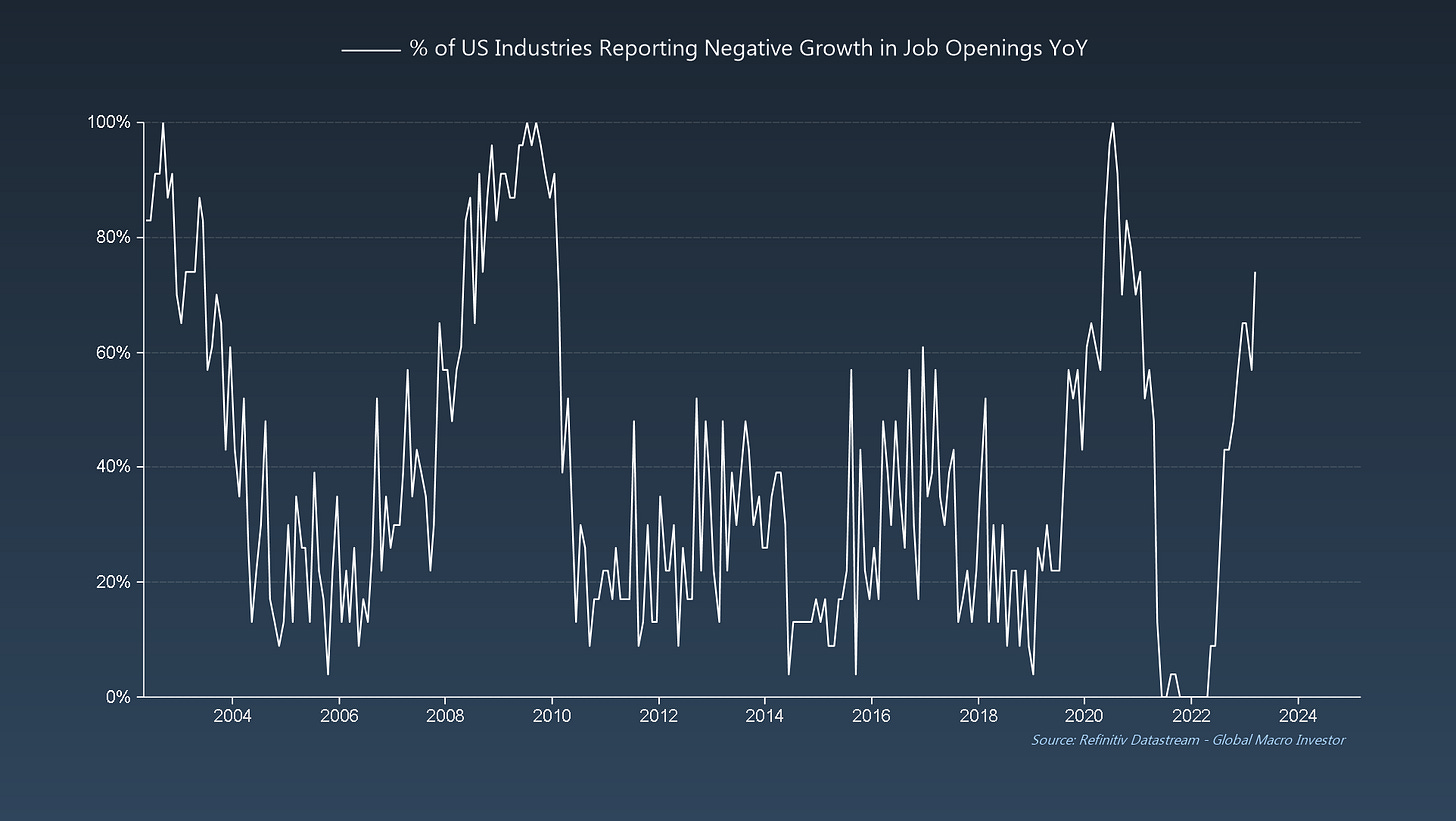
GMI Chart 1 – % of US Industries Reporting Negative Growth in Job Openings YoY
This week, the updated Job Openings data for January showed a big jump in the % of US Industries Reporting Negative Growth in Job Openings, up to 74% from 57% in December – the highest level since November 2020 and in clear recession territory...
GMI Chart 2 – JOLTS Job Openings YoY% vs. Chicago, Richmond, and Philly Average PMI
The deterioration in Job Openings is also very likely to continue over the next couple of months...
GMI Chart 3 – US Nonfarm Payrolls MoM vs. Challenger US Job Cut Announcements YoY%
Nonfarm Payrolls came in stronger than expected at 311k (225k estimate) for the month of February though there remains an ominous gap with Challenger Job Cuts, which came in still extremely elevated at 410% year-on-year this week...
... and our models continue to suggest that growth in NFPs will soon go negative...
GMI Chart 4 – % of US States with Decreasing Coincident Activity vs. US Unemployment Rate
Crucially for our take on the Fed (more on this later), the unemployment rate ticked higher in February to 3.6% as we have been expecting. And, based on the continued deterioration in US coincident data, this would suggest that we should be nearer 4.5% by mid 2023...
GMI Chart 5 – ISM vs. US Unemployment Rate YoY
Like CPI, the labour market is an extremely lagging indication of economic health and what we’re currently looking at in terms of unemployment data is really a reflection of the economy around six months ago. By next month, the unemployment rate will very likely be positive in year-on-year terms and is projected to rise around 1% by August according to current ISM data...
This is important because just a 0.5% rise off the lows has been the 100% recession threshold going back to 1950...
... and irrespective of inflationary regime, the Fed has always stopped rate hikes with just a 0.5% rise in unemployment off the lows...
Our take on the Fed was that we would probably get one more rate hike at the end of this month and then the Fed would be done. Not only is the labour market starting to weaken, but we’re also still projecting inflation to totally collapse.
However, after this week’s developments and the downfall of Silicon Valley Bank, even a final rate hike feels like it could be taken off the table. The Fed needs to get rates back below 2% ASAP or they risk this snowballing into a MUCH bigger problem – the chart on US regional banks (KRE) looks like a massive head-and-shoulders top pattern...
Our expectation is for the FDIC/Fed/Gov to make whole ALL depositors in full immediately, or they will spark a bank run next week. At the time of writing, details are yet to be announced.
Outside of SVB’s specific concerns, a bigger issue remains that with a negative yield curve, the smaller banks cannot offer competitive rates of interest on their balances and make money. If they offer 4% interest, for example, their profitability collapses – as would their share price – creating further issues. So instead, they offer 0.5% but depositors move cash into Money Market Funds, CDs, or Bills (via Treasury Direct) and get 5%! That steady deposit drain weakens the smaller banks who aren’t subject to the same regulation as the very largest banks that hold huge interest paying regulatory reserves in the Reverse Repo market.
In the end the Fed will eventually need to stop QT and cut rates, even if they do stop the bank run, because the banks will keep losing depositors with such high rates, and further bank collapses may occur (but with the depositors being made whole). A massively indebted system can’t survive on high rates for long. As soon as inflation begins to fall sharply and unemployment rises (in the coming few months), the Fed will need to signal the beginning of the unwind of its excessively tight policy based on lagging indicators.
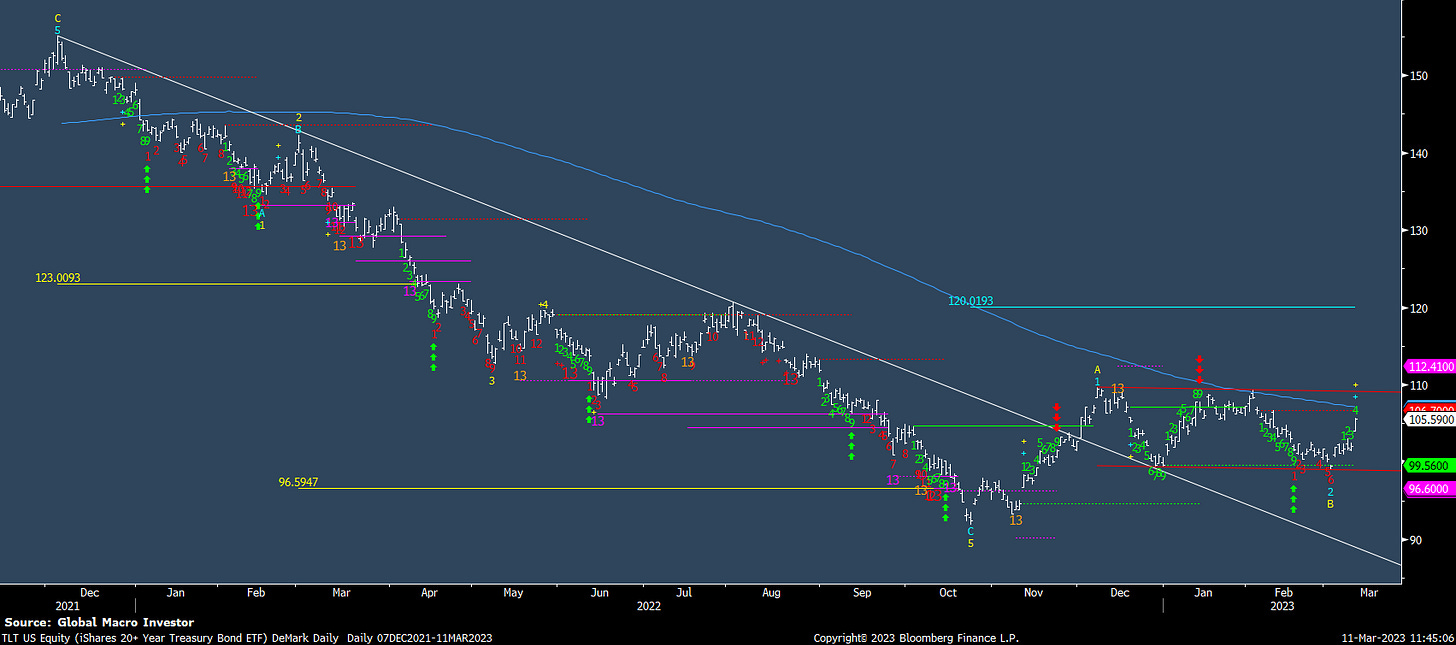
To conclude, we think bonds are probably still the best risk/reward trade out there right now.
The daily DeMark 9 Setups have been working well at flagging turning points, and the February weakness in TLT back to the December lows and the TDST at 99.56, has unlocked a wave 3 price objective higher to 120. We were early on bonds last year but, given this week’s data, the new SVB developments and the fact that speculators remain near-record short USTs, our confidence on this trade is only growing.
It feels like it’s time to pull out our old “Buy Bonds, Wear Diamonds” T-shirts again. Let’s see...
Stay vigilant next week and good luck out there...
Raoul Pal – CEO, Founder - Global Macro Investor
Julien Bittel – Head of Macro Research - Global Macro Investor


Great charts! All roads lead to crypto. Just hodl.