When in Doubt, Zoom Out: The GMI Top 5 Charts That Make You Go Hmmm...
To help you think big picture, we’re going to again focus on a few interesting charts that are on our radar in this week’s newsletter... when in doubt, zoom out!!!
As ever, much fuller and more in-depth analysis can be found in Global Macro Investor (www.globalmacroinvestor.com) and Real Vision Pro Macro https://www.realvision.com/pricing) . Global Macro Investor is our full institutional research service and Real Vision Pro Macro is the sophisticated retail investor service, which is co-authored with leading research firm MI2 Partners.
Let’s dive right in...
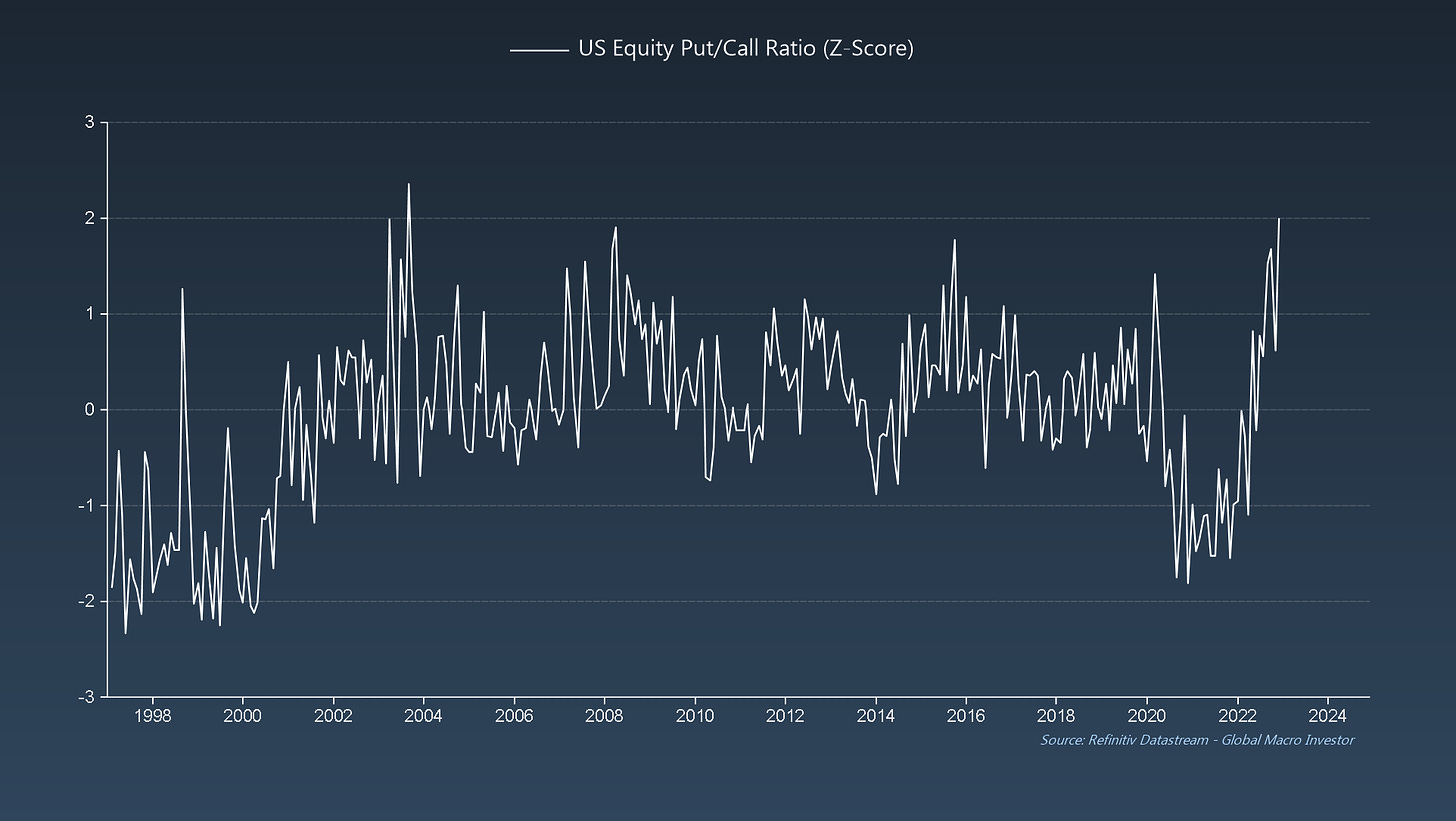
GMI Chart 1 – US Equity Put/Call Ratio
The US Equity Put/Call Ratio just hit a twenty-year high this week, as investors scramble to accumulate downside protection to hedge against the recession...
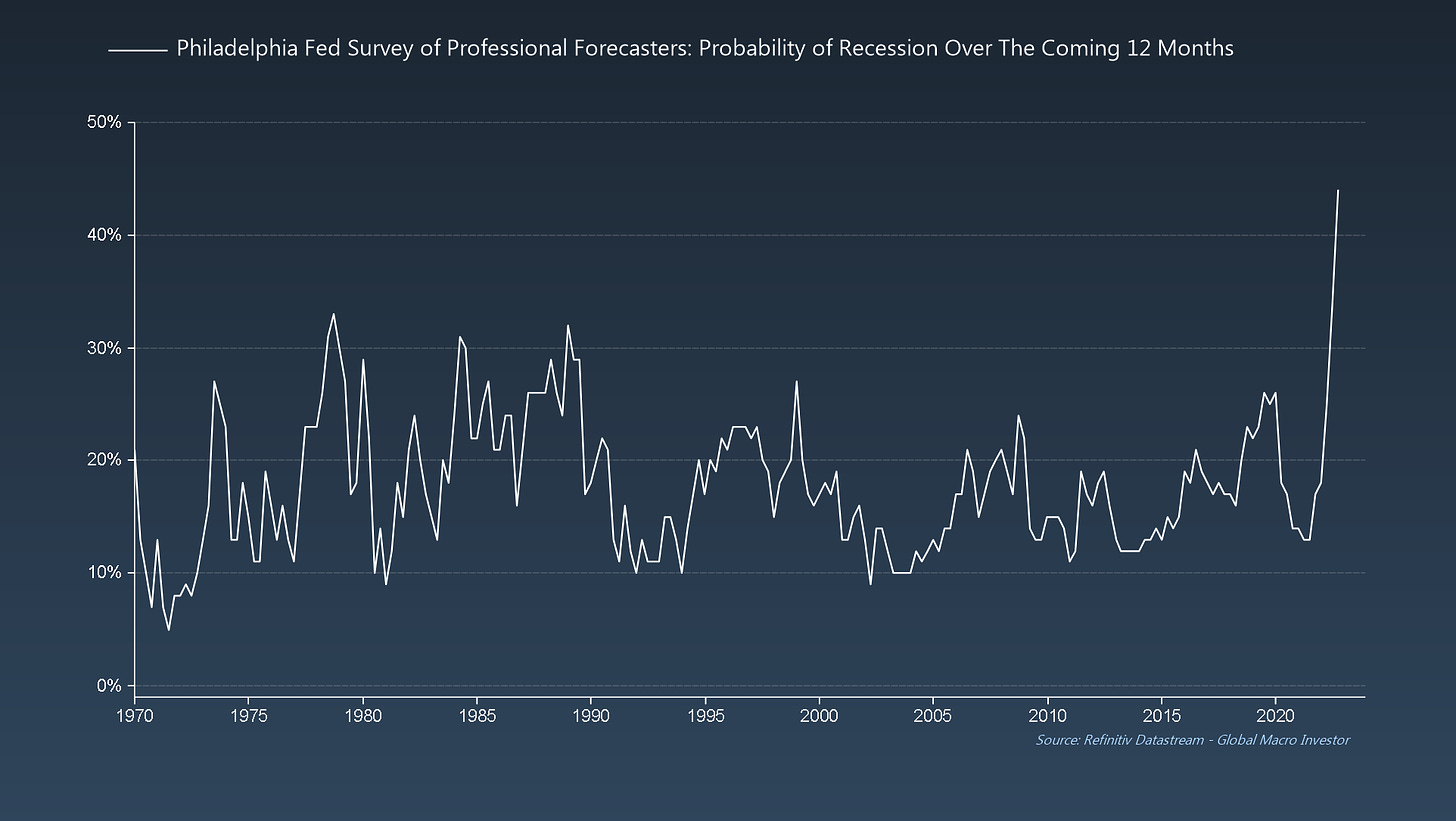
GMI Chart 2 – Philadelphia Fed Survey: Probability of Recession over the Coming 12 Months
... that literally EVERYONE sees coming – officially the most anticipated recession on record!!!
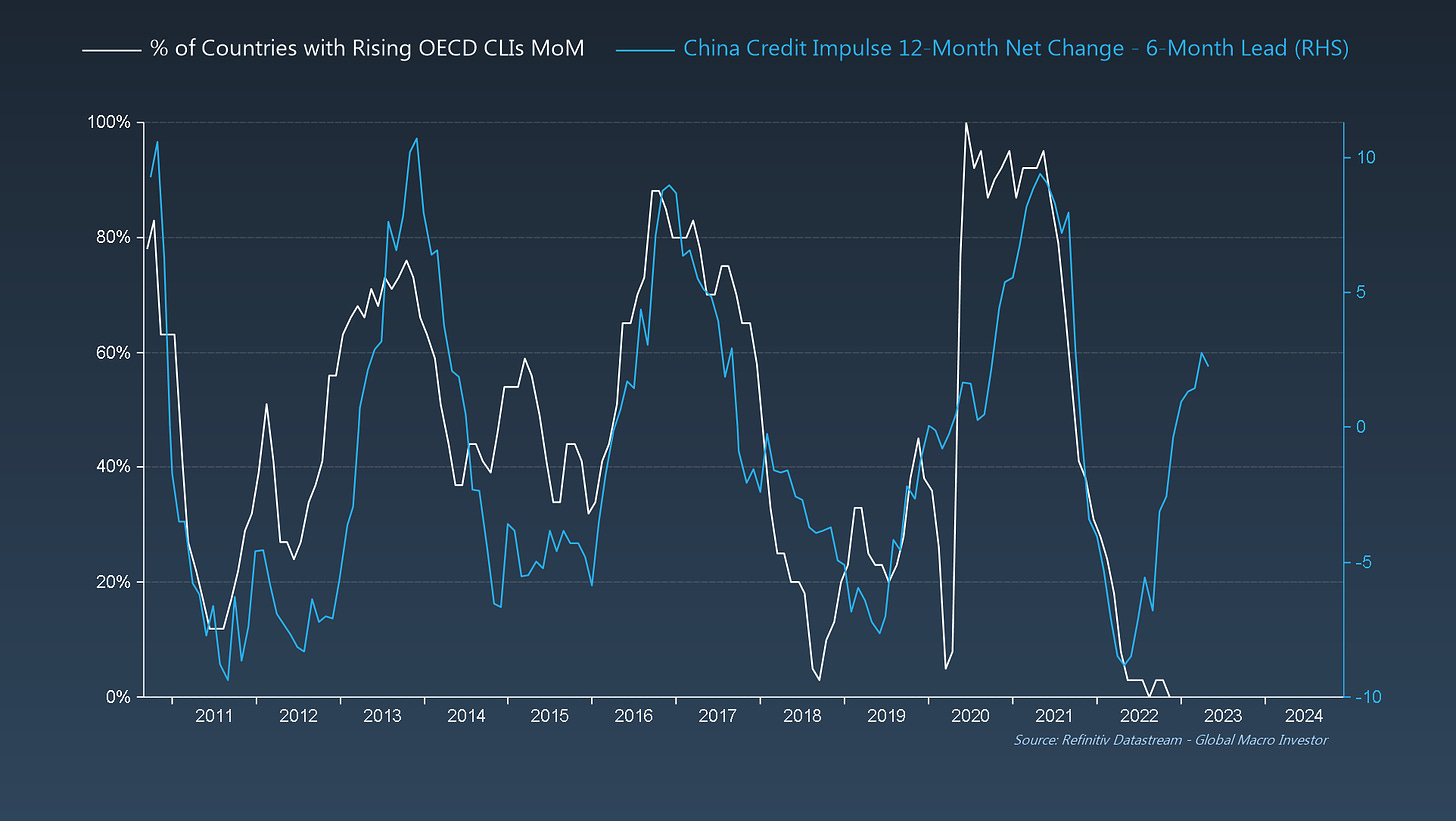
GMI Chart 3 – % of Countries with Rising OECD CLIs MoM vs. China Credit Impulse
And this is coming at a time when global growth momentum should soon bounce on improving Chinese liquidity conditions, which leads OECD country breadth by six months...
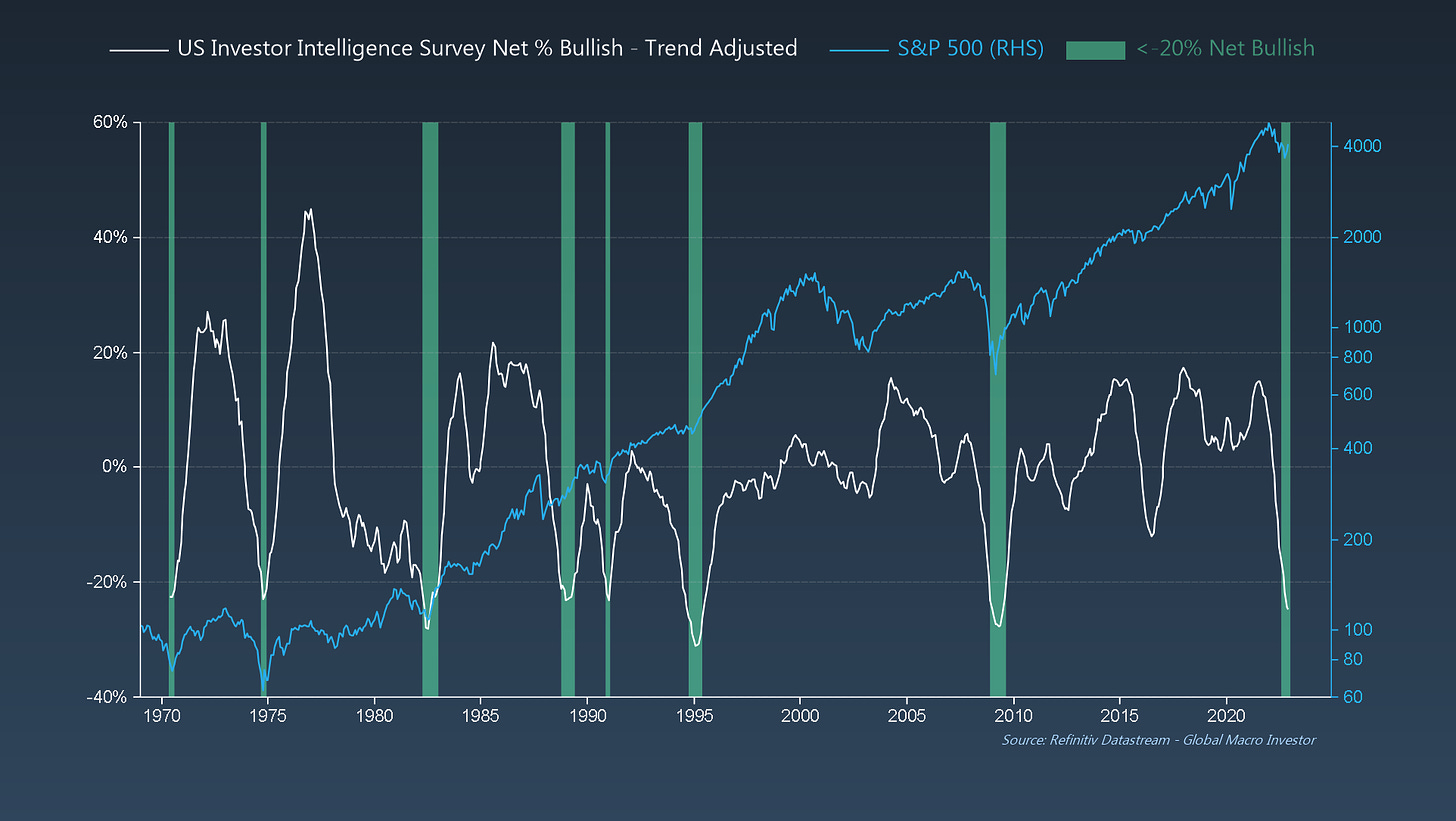
GMI Chart 4 – US Investor Intelligence Survey Net % Bullish vs. S&P 500
Additionally, literally EVERYONE is already bearish; this chart speaks for itself and dates back to 1970...
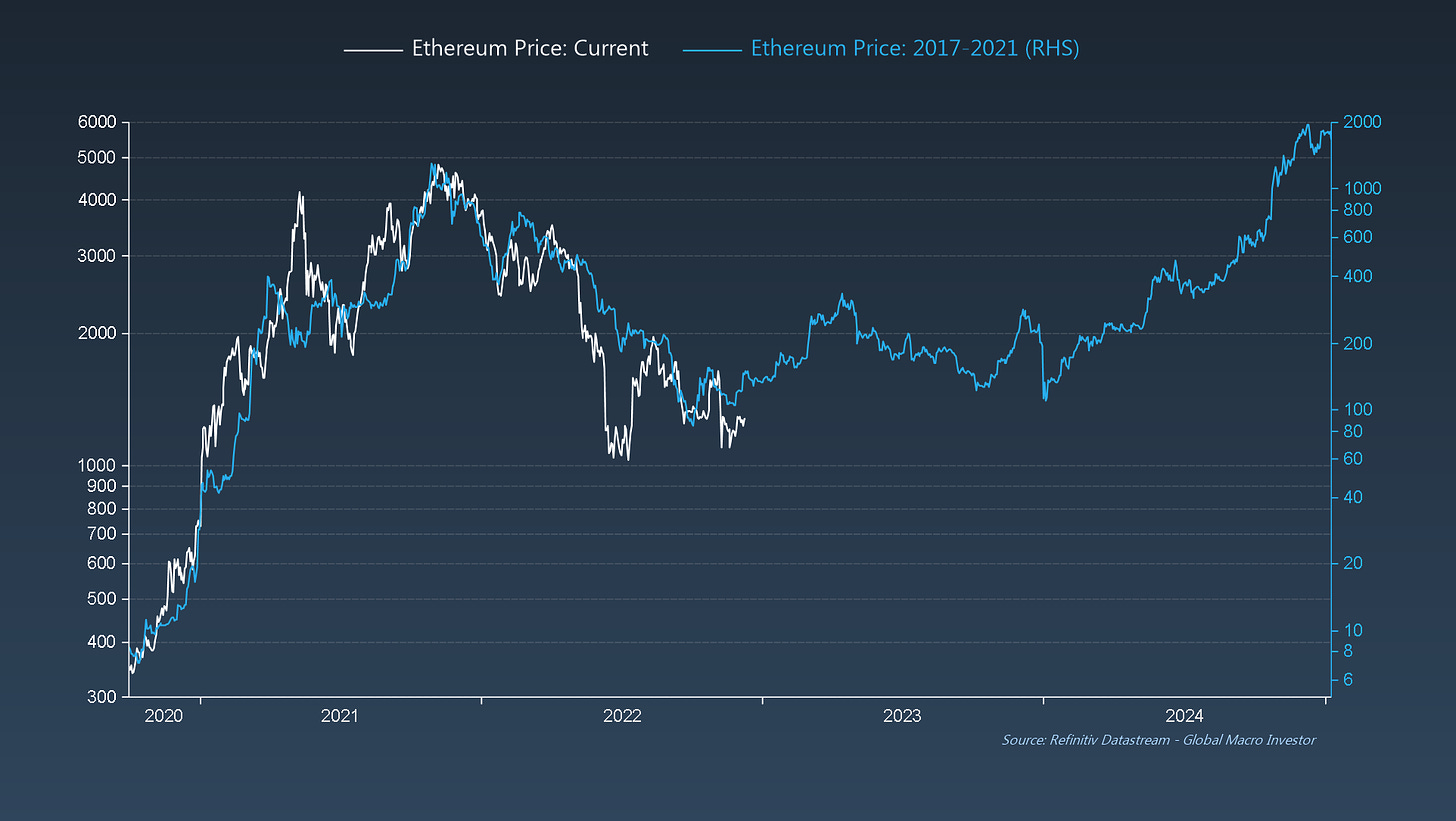
GMI Chart 5 – Ethereum Today vs. 2017-2021 Analog
Finally, we have our eyes on this Ethereum chart versus its 2017-2021 analog. Obviously, price analogs never work out perfectly, but it’s still something interesting to have on your radar...
The GMI Big Picture
We can all agree that a recession is coming but...
What we disagree on is not so much the magnitude of the recession (ISM could easily hit 40), but the duration of the recession itself. While consensus is still very much talking about an increase in financial conditions next year and therefore an entrenched global recession, we see the opposite happening...
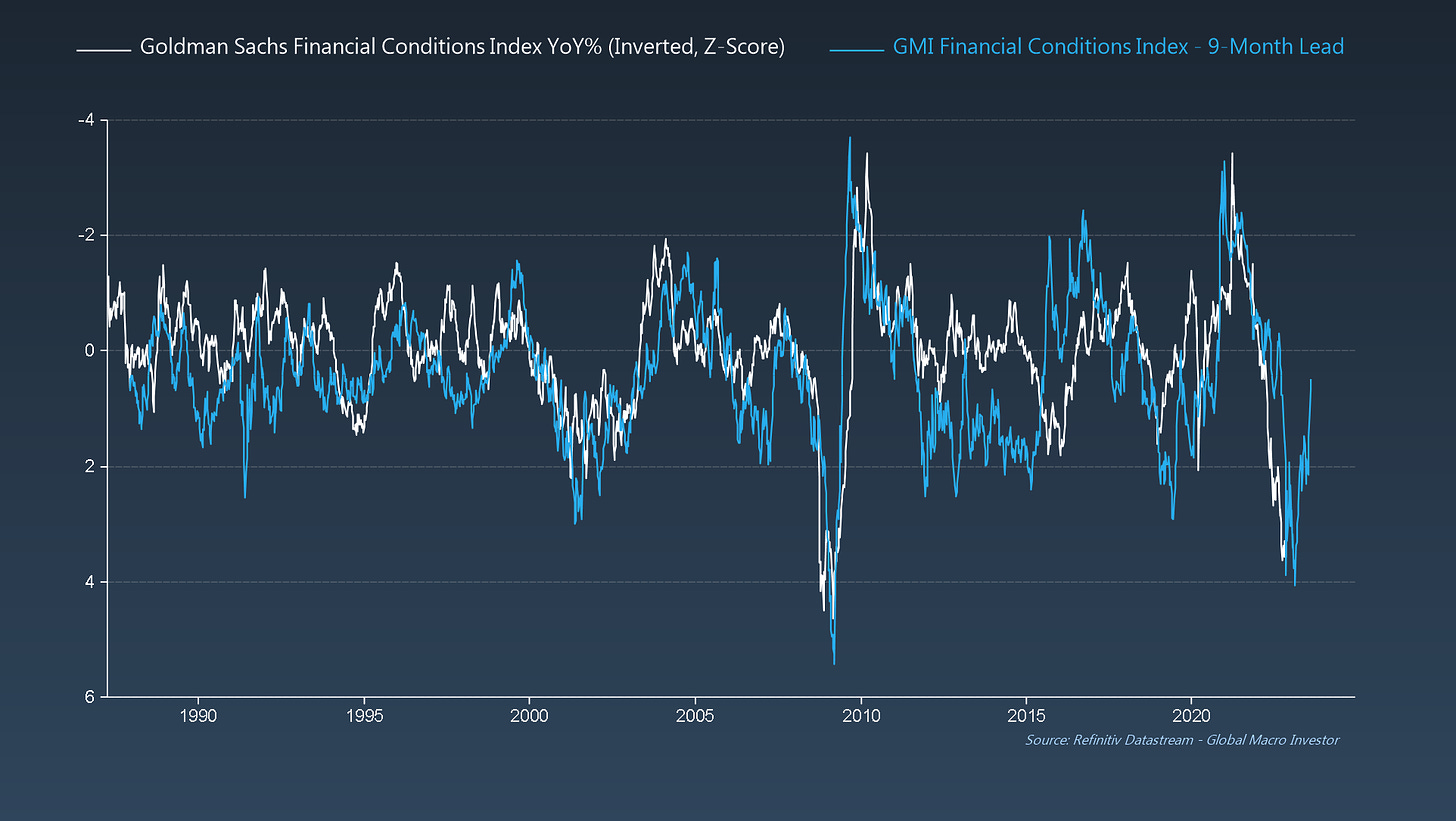
Our lead indicators indicate that financial conditions will soon start to ease, and potentially significantly.
Financial Conditions (here inverted) are already as tight as they were during the Global Financial Crisis (+4 standard deviations) and inflationary pressures are already starting to ease. Bond yields and the dollar are down as the market continues to price in peak Fed hawkishness and, bar anything systemic and entrenched (not our base case), credit spreads are not going to blow out like they did in 2008...
To conclude, while nearly everyone else we read remains bearish on 2023, we see reasons to be more optimistic.
Can the S&P 500 still go a bit lower? Sure. But does a final drop mean that we have to make new lows and that equities NEED to fall peak-to-trough 50% as they did in 2000 and 2008? No.
This recession is a result of soaring real yields and an unprecedented tightening in financial conditions,both of which can be easily remedied with rate cuts + QE.
Also, as discussed in previous weekly notes, in our opinion the BIG macro imbalances required to see a repeat of the GFC just aren’t there. Let’s see...
Plenty of charts and food for thought this week. Enjoy!
Raoul Pal – CEO, Founder - Global Macro Investor
Julien Bittel – Head of Macro Research - Global Macro Investor


