We’re on the precipice of a major turning point... the bears will soon go into hiding and the bulls will return to resume the uptrend they left behind not so long ago.
Allow me to explain…
You see, as WW2 came to an end in 1945, the world found itself in a very similar situation to that of today. High debt, negative real rates, fiscally driven capital allocation and rapid technological advancements were all present back then just like they are today. That’s why my base case for the coming decade+ remains the period from 1945 to 1965.
Down, then up (but less) …
Let’s look at CPI. If you examine the structure of inflation during that twenty-year period and today, you’ll see that they are extremely similar. Both experienced major supply/demand issues as the world emerged from war/pandemic and factories began to reopen. I think we see a comparable outcome: inflation will collapse (probably negative) followed by a lower rebound (and YCC to stop rates rising to kill growth) before settling back into a low range…
Now, let’s look at stocks. Back then, equities rocketed with the announcement of war (same as the pandemic), the economy subsequently fell into recession shortly after the end of the war, with the market correcting around 20%. Keep in mind that this was a generational low that became the jumping-off point for a 5x increase in the following two decades (and 9x from the low during the war) ...
What were the driving forces of that bull market? Negative real rates, yield curve control, massive fiscal stimulus, and a rapid increase in GDP growth.
Much like today, GDP remained volatile, experiencing large gyrations throughout. However, those gyrations played a critical role in stopping excess leverage from building up over time. Nonetheless, GDP managed to average 4.5%...
The grand result at the end of this? Government debt to GDP plummeted from 125% where it is today, to 30%. Spending gave way to fiscal austerity which was counterbalanced by GDP growth…
You’ll soon see why this is important…
In last month’s GMI entitled Broken Markets and the Cowbell, I discussed how macro conditions would lead to a reversal of monetary and fiscal policy that would see the taps come back on… well, here we go!
My thoughts are that the coming change to the bond market, the easing of bank balance sheet constraints, the Fed pause as well as the fiscal stimulus, all come together to generate a reversal in M2 growth.
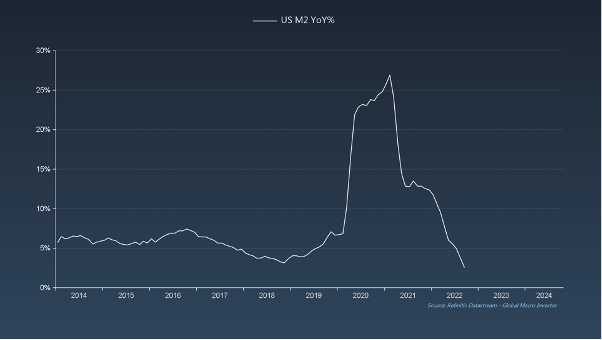
US M2 YoY is right back where it was in 2018 when they last reversed course on rates and QE…
And this is not exclusive to the US; Global M2 has been falling around the world...
But, as I’ve discussed many times before, the business cycle does an epic job of calling the turn in both Fed liquidity and Global M2.
Once the ISM crosses 50, liquidity comes in to try and buffer it. It’s possible that changes in bank regulations or Operation Twist will kick off the liquidity boom...
There’s something else happening in the world though… that is, the growth in Chinese credit and the rise in Chinese M2 that comes with it. In so many words, the cowbell has already started ringing in China…
Pay close attention here: the increase in Chinese Cowbell, excuse me, Chinese Credit Impulse leads Global M2 by five months. What does this mean? We’re right at the point when M2 will start to rise. The return of liquidity is imminent…
Both the ISM and China Credit are screaming that M2 is about turn… hard.
Interestingly enough, it also leads all the major PMIs (by varying lags), which suggests that the bottom of the business cycle is coming in Q1 of 2023…
So, to recap – first M2 turns then the business cycle bottoms and turns.
And when M2 turns, markets turn. Have a look at the SPX…
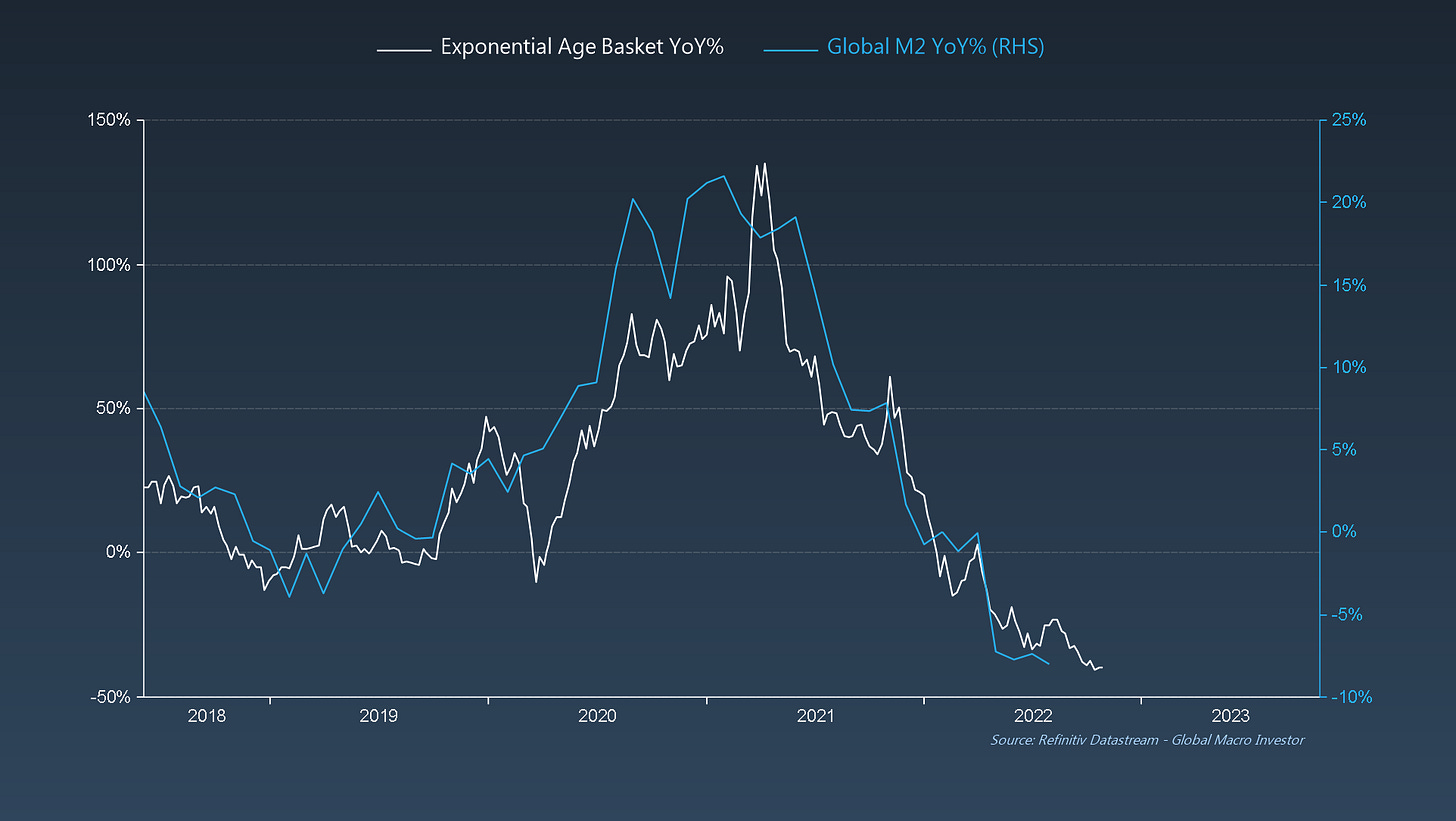
Here’s the Exponential Age Basket of growth tech…
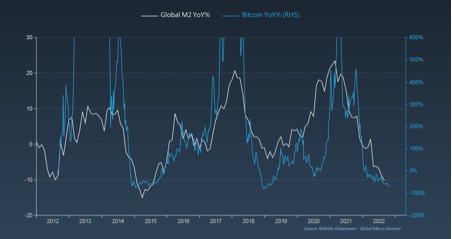
... and here’s Bitcoin…
Get the point? This is a key turning point in liquidity and, as the title to this article declares, when liquidity changes, everything changes!
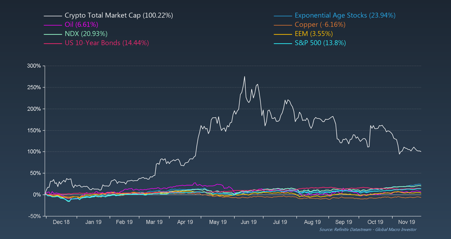
This is what happened back in 2018…
The growth end of tech (Exponential Age) went up 24%, NDX 21% and bonds 14.5%.
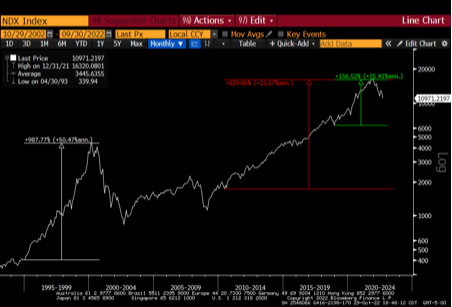
The NDX is a particularly telling story as it rockets every time that M2 recovers from a sharp fall. The last three times were in 1995, 2010 and 2018.
Have a look at the performance of tech stocks. Absolutely STUNNING: 50% annualised rate of change, 18.5% annualised rate of change and 26% annualised...
This leads us to the bullshit story of higher rates…
Higher rates are a red herring. Many will disagree but, in my view, it’s a false narrative. The fact is that higher rates are not a hurdle for tech or the broader market and this is why I really don’t care if rates stay at let’s say 3% (which I don’t think they do).
You’ve heard me say this many times: it is the rate of change in rates that matter, not the level of rates. It’s total bullshit to suggest that if rates are stuck at 4% then growth stocks, crypto etc., will suffer endlessly. This is not how the world works. You can also throw out that nonsense about cost of capital. The adoption of technology is far too fast for that to matter.
Consider the case Google overleaf… producing average annual returns of almost 30% with no debt. Now, do you think google gives a shit if the cost of capital is at 1% or %5? Absolutely not! And neither do investors…
Remember that chart I showed earlier with the performance of all assets? Well, it’s missing one key asset: Bitcoin.
When you add it in, everything else looks like a joke…
Paul Tudor Jones once said, when the money taps are back on you want to back the fastest horse. In the case of 2020/2021 he was referring to Bitcoin. This time, it will be crypto overall.
Let’s not forget that back in 2018, Exponential Age stocks rose 24% while BTC jumped 100%!
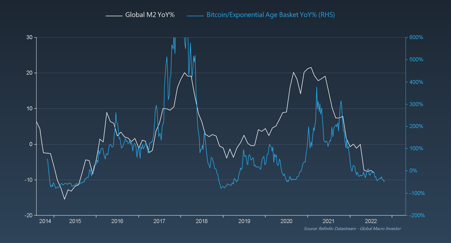
Here’s a chart of BTC vs Global M2. Notice anything strange? Yes, we can’t scale the top of the chart because when M2 goes up considerably, Bitcoin goes EXPONENTIAL…
Now, you may be thinking, “Well, that is comparing to the peak, BTC has collapsed” and of course, the “Fear of Change” crowd on Twitter will be yelling, “It was all a bubble! Bitcoin is WorTHleSS!”
Let us not forget though, that what markets give, they don’t take back… that’s the nature of secular trends.
How very wrong everyone is. You see, versus the SPX, BTC is still up 3.4x from the 2018 low. Even after a 65% correction!!!
Not to mention the ratio between BTC and SPX versus M2 where BTC outperforms 6x or more when M2 goes up.
This happens Every. Single. Time.
When you look at the ratio of BTC to the Exponential Age Basket, it outperforms several hundred percent!
Oh, and then there’s this… BTC (inverted) is following the RRP to perfection! When the RRP starts reducing, BTC is going to fucking explode…
We’ve covered a lot in this article so let’s recap so that we’re all on the same page.
What is happening in these charts is simple:
1. Assets are driven by liquidity. When liquidity goes up, so do assets.
2. Assets based on cyclical trends – like commodities – do very well.
3. Assets based on earnings – such as the SPX – do even better, but no better than the Fed balance sheet over time.
4. Assets which have a secular tailwind outperform, such as the NDX or Sensex.
5. Assets highly dependent on liquidity and with an exponential secular trend, outperform all the above.
6. Bitcoin with its inbuilt incentive mechanism whose technology is adopted faster while in an exponential secular trend, destroys the performance of all other assets.
Remember, when liquidity changes, everything changes. NOW is the time to start putting your shopping list together.
Good luck out there.









RRP? Might need a glossary for this piece!
Still gold, though, as ever.
And if inflation becomes sticky, the boom may be more shortlived.
Jim Puplava reckons inflation takes 10 years to disperse.
Raoul, this is great, thanks. Re govt debt coming down like in the '45 to '65 period ... given how much bigger (quantum) both govt and its debt is now do you still believe it comes down as quickly? If yes, is this because GDP itself is also bigger by a similar quantum?